Oxybutynin Chloride
Product Images NDC 10544-559

4 FDA label images from Blenheim Pharmacal, Inc. · Packaging, Regulatory Labels, and Product Appearance

Product Visual Gallery

This gallery contains 4 technical images submitted to the FDA as part of the official labeling for Oxybutynin Chloride (NDC 10544-559). Unlike standard consumer photos, these assets often include clinical data figures, molecular chemical structures, and official manufacturer packaging layouts.

As provided by Blenheim Pharmacal, Inc., these visuals offer a comprehensive scientific overview of the product's physical and chemical identity, aiding pharmacists and researchers in product verification and study.

FDA Label Image

Label 5mg 90ct (Label Oxybutynin Chloride Tabs 5mg Bpi(10544 559 90) Teva(50111 456 03) Rev2)

Label 5mg 90ct (Label Oxybutynin Chloride Tabs 5mg  Bpi(10544 559 90) Teva(50111 456 03) Rev2)
Oxybutynin Chloride Tablets USP 5mg label showing product name, strength, and 90 tablets quantity. The label includes storage instructions to keep at controlled room temperature and in a light-resistant container. Manufactured by Blenheim Pharmacal, Inc. in the USA. It also displays NDC 10544-559-90, manufacturer code, lot number, and expiration date placeholders.*
FDA Label Image

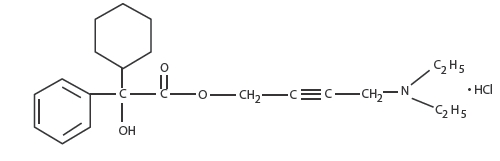
Oxybutynin Structural Formula (F31ecbfd 0404 4601 9887 14dbba9cb7ce 01)

Oxybutynin Structural Formula (F31ecbfd 0404 4601 9887 14dbba9cb7ce 01)
Chemical structure of oxybutynin chloride showing its molecular arrangement with a phenyl ring, ester linkage, alkyne group, and diethylamino side chain bonded to a hydrochloride moiety.*
FDA Label Image

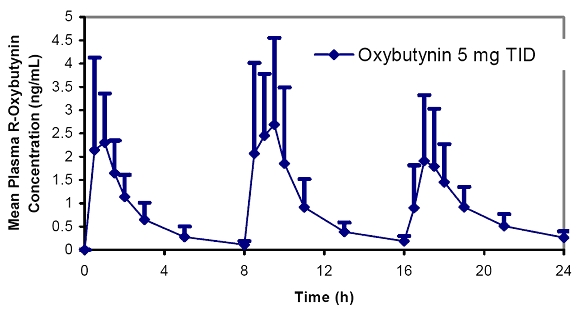
Figure 1 (F31ecbfd 0404 4601 9887 14dbba9cb7ce 02)

Figure 1 (F31ecbfd 0404 4601 9887 14dbba9cb7ce 02)
A line graph depicting mean plasma R-oxybutynin concentration (ng/mL) over 24 hours following administration of Oxybutynin 5 mg TID. The x-axis shows time in hours, and the y-axis shows concentration. Data points include error bars indicating variability.*
FDA Label Image

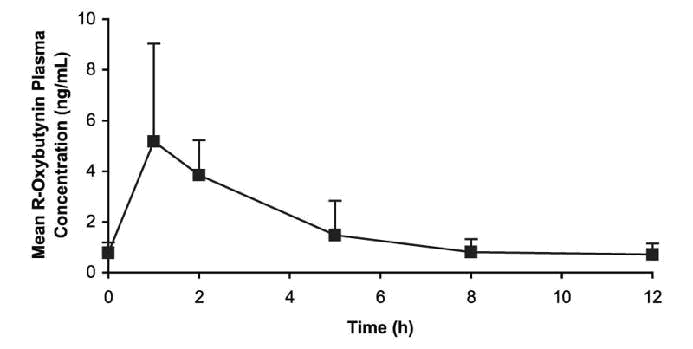
Figure 2 Mean Steady-state (F31ecbfd 0404 4601 9887 14dbba9cb7ce 03)

Figure 2 Mean Steady-state (F31ecbfd 0404 4601 9887 14dbba9cb7ce 03)
A line graph illustrating the mean R-Oxybutynin plasma concentration (ng/mL) over time (hours). The graph shows peak concentration shortly after administration with a subsequent decline over 12 hours, including error bars for variability at each time point.*

* About these descriptions: Image descriptions on this page are generated by automated AI analysis of the product label images from the manufacturer's FDA label submission (SPL). They are provided for reference only and may contain errors or omissions. Always rely on the printed label itself and the official FDA labeling, and consult a pharmacist or healthcare professional with any questions about this product.