Tizanidine
Product Images NDC 10544-863

5 FDA label images from Blenheim Pharmacal, Inc. · Packaging, Regulatory Labels, and Product Appearance

Product Visual Gallery

This gallery contains 5 technical images submitted to the FDA as part of the official labeling for Tizanidine (NDC 10544-863). Unlike standard consumer photos, these assets often include clinical data figures, molecular chemical structures, and official manufacturer packaging layouts.

As provided by Blenheim Pharmacal, Inc., these visuals offer a comprehensive scientific overview of the product's physical and chemical identity, aiding pharmacists and researchers in product verification and study.

FDA Label Image

Label 2mg 30ct (Label Tizanidine Tabs 2mg Bpi(10544 863 30) Apotex(60505 0251 3) Rev1)

Label 2mg 30ct (Label Tizanidine Tabs 2mg  Bpi(10544 863 30) Apotex(60505 0251 3) Rev1)
Label for Tizanidine Tablets USP 2mg by Blenheim Pharmacal, Inc., containing 30 tablets. The label includes storage instructions, dosage note to see package insert, and indicates prescription use only. Packaging details such as NDC number 10544-863-30, manufacturer code 60505-0251-3, and barcodes are shown.*
FDA Label Image

Structure (Tizanidine Imtb 01)

Structure (Tizanidine Imtb 01)
Chemical structure diagram of tizanidine hydrochloride, showing the molecular arrangement including a chlorinated ring and multiple nitrogen and sulfur atoms.*
FDA Label Image

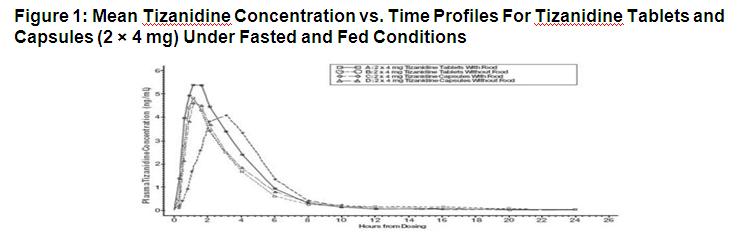
Graph (Tizanidine Imtb 02)

Graph (Tizanidine Imtb 02)
A line graph illustrating mean tizanidine concentration (ng/mL) over time (hours) post-dosing for tizanidine tablets and capsules (2 x 4 mg) under fasted and fed conditions, showing different profiles for each formulation and condition.*
FDA Label Image

Graph (Tizanidine Imtb 03)

Graph (Tizanidine Imtb 03)
A line chart titled 'Single Dose Study—Mean Change in Muscle Tone from Baseline as Measured by the Ashworth Scale ± 95% Confidence Interval.' It shows improvement in Ashworth scores over 6 hours post-dose for three groups: 16 mg tizanidine, 8 mg tizanidine, and placebo. The 16 mg dose shows the greatest improvement, followed by 8 mg, with placebo least effective.*
FDA Label Image

Graph (Tizanidine Imtb 04)

Graph (Tizanidine Imtb 04)
A chart depicting mean change in muscle tone on the Ashworth Scale over a seven-week study period, comparing tizanidine (mean dose 28.8 mg) to placebo. The vertical axis represents improvement in Ashworth score, with negative scores indicating improvement. Data points with 95% confidence intervals are shown at three time points: end of titration (week 3), end of maintenance (week 7), and study endpoint.*

* About these descriptions: Image descriptions on this page are generated by automated AI analysis of the product label images from the manufacturer's FDA label submission (SPL). They are provided for reference only and may contain errors or omissions. Always rely on the printed label itself and the official FDA labeling, and consult a pharmacist or healthcare professional with any questions about this product.