Atovaquone Oral Suspension
Product Images NDC 10702-223

13 FDA label images from Kvk-tech, Inc. · Packaging, Regulatory Labels, and Product Appearance

Product Visual Gallery

This gallery contains 13 technical images submitted to the FDA as part of the official labeling for Atovaquone Oral Suspension (NDC 10702-223). Unlike standard consumer photos, these assets often include clinical data figures, molecular chemical structures, and official manufacturer packaging layouts.

As provided by Kvk-tech, Inc., these visuals offer a comprehensive scientific overview of the product's physical and chemical identity, aiding pharmacists and researchers in product verification and study.

FDA Label Image

Carton Label

Carton Label
Atovaquone Oral Suspension, USP 750 mg/5 mL carton label, showing product name, strength, and dosage form as an oral suspension. The label includes NDC 10702-223, a net content of 210 mL, manufacturer KVK-Tech, Inc., and storage instructions. Additional visible information includes alcohol content, barcode, and a note that the suspension is sugar-free and contains an ingredient made from gluten-containing grain.*
FDA Label Image

Container Label

Container Label
Label for Atovaquone Oral Suspension USP 750 mg/5 mL, a prescription oral suspension by KVK-Tech, Inc. The 210 mL container includes dosage and storage instructions, noting sugar-free content, alcohol limit, and shaking before use. It warns not to use if the seal is broken, and includes manufacturer details and a barcode.*
FDA Label Image

Figure 01

Figure 01
Chemical structure of Atovaquone, the active ingredient in Atovaquone Oral Suspension 750 mg/5mL by KVK-Tech, Inc.*
FDA Label Image

Figure 02

FDA Label Image

Table 01

Table 01
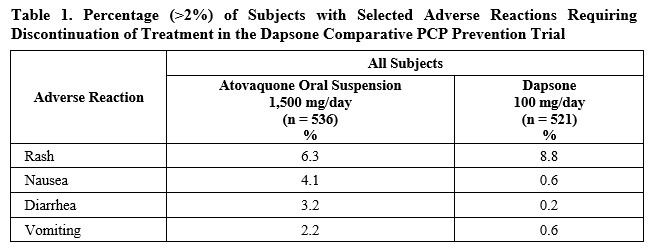
A table titled 'Percentage (>2%) of Subjects with Selected Adverse Reactions Requiring Discontinuation of Treatment in the Dapsone Comparative PCP Prevention Trial' compares adverse reactions for Atovaquone Oral Suspension 1,500 mg/day (n=536) and Dapsone 100 mg/day (n=521). Adverse reactions listed are rash, nausea, diarrhea, and vomiting, with percentages shown for each treatment group.*
FDA Label Image

Table 02

Table 02
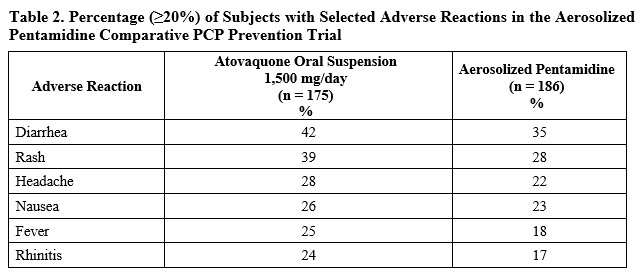
A data table titled 'Table 2' summarizing the percentage of subjects with selected adverse reactions (≥20%) in a PCP prevention trial comparing Atovaquone Oral Suspension 1,500 mg/day and Aerosolized Pentamidine. The table lists adverse reactions such as diarrhea, rash, headache, nausea, fever, and rhinitis, showing higher percentages generally for Atovaquone compared to Pentamidine.*
FDA Label Image

Table 03

Table 03
A data table titled 'Percentage (≥10%) of Subjects with Selected Adverse Reactions in the TMP-SMX Comparative PCP Treatment Trial' presenting adverse reaction percentages for Atovaquone Tablets and TMP-SMX. Reactions include rash, nausea, diarrhea, headache, vomiting, fever, and insomnia with respective percentages listed for each treatment group.*
FDA Label Image

Table 04

Table 04
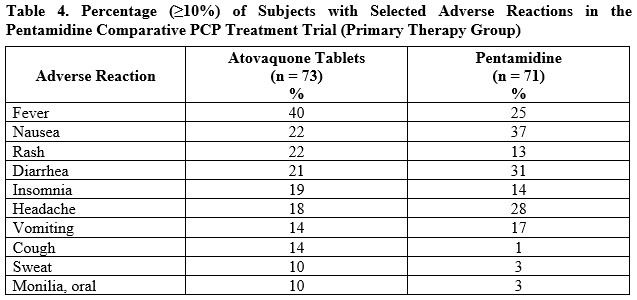
Data table showing the percentage of subjects experiencing selected adverse reactions (≥10%) in a Pentamidine Comparative PCP Treatment Trial (Primary Therapy Group). It compares adverse reactions between Atovaquone Tablets (n=73) and Pentamidine (n=71), listing symptoms such as fever, nausea, rash, diarrhea, insomnia, headache, vomiting, cough, sweat, and oral monilia with corresponding percentages for each group.*
FDA Label Image

Table 05

Table 05
Table presenting average steady-state plasma concentrations of Atovaquone in pediatric subjects by age group (1-3 months, >3-24 months, >2-13 years) and dose levels (10 mg/kg, 30 mg/kg, 45 mg/kg) of Atovaquone Oral Suspension. Values are shown as mean ± SD in mcg/mL with sample sizes indicated.*
FDA Label Image

Table 06

Table 06
A data table titled 'Relationship between Plasma Atovaquone Concentrations and Successful Treatment Outcome' showing steady-state plasma atovaquone concentrations in micrograms per milliliter alongside the number and percentage of successful treatments for each concentration range.*
FDA Label Image

Table 07

Table 07
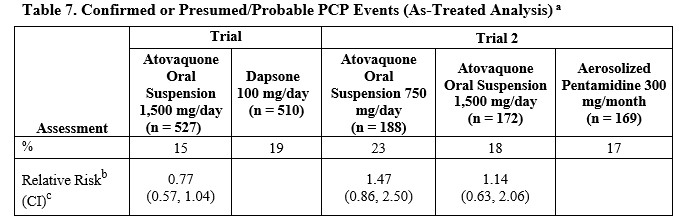
A data table titled 'Table 7. Confirmed or Presumed/Probable PCP Events (As-Treated Analysis)' comparing trial results for Atovaquone Oral Suspension at 750 mg/5 mL and other dosages versus comparator drugs. The table shows assessment parameters such as percentage and relative risk with confidence intervals across different trials and drug regimens.*
FDA Label Image

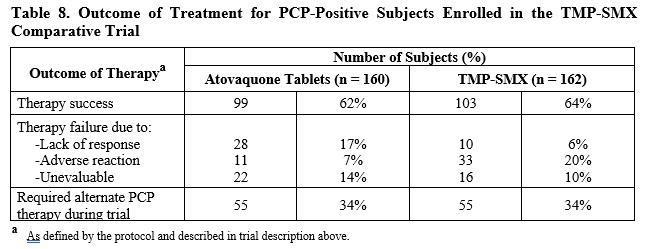
Table 08

Table 08
A comparison table showing the outcome of treatment for PCP-positive subjects enrolled in a TMP-SMX comparative trial. The table lists therapy success, therapy failure due to lack of response, adverse reaction, and unevaluable cases, as well as the number requiring alternate PCP therapy during the trial for subjects taking Atovaquone tablets versus TMP-SMX.*
FDA Label Image

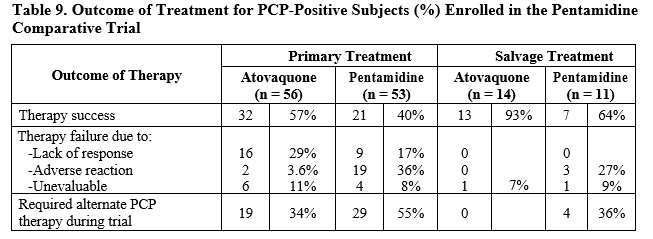
Table 09

Table 09
A data table titled 'Outcome of Treatment for PCP-Positive Subjects (%) Enrolled in the Pentamidine Comparative Trial.' It compares primary and salvage treatment results for Atovaquone and Pentamidine in terms of therapy success, failure reasons (lack of response, adverse reaction, unevaluable), and requirement for alternate PCP therapy during the trial, expressed as number and percentage of subjects.*

* About these descriptions: Image descriptions on this page are generated by automated AI analysis of the product label images from the manufacturer's FDA label submission (SPL). They are provided for reference only and may contain errors or omissions. Always rely on the printed label itself and the official FDA labeling, and consult a pharmacist or healthcare professional with any questions about this product.