Leflunomide Tablet
Product Images NDC 10702-278

14 FDA label images from Kvk-tech, Inc. · Packaging, Regulatory Labels, and Product Appearance

Product Visual Gallery

This gallery contains 14 technical images submitted to the FDA as part of the official labeling for Leflunomide (NDC 10702-278). Unlike standard consumer photos, these assets often include clinical data figures, molecular chemical structures, and official manufacturer packaging layouts.

As provided by Kvk-tech, Inc., these visuals offer a comprehensive scientific overview of the product's physical and chemical identity, aiding pharmacists and researchers in product verification and study.

FDA Label Image

Chemical-structure-description (Chemical Structure Description)
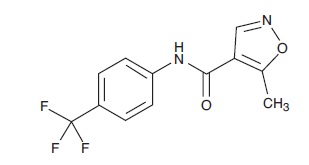
Chemical-structure-description (Chemical Structure Description)
Chemical structure of the active ingredient Leflunomide, showing its molecular arrangement including a trifluoromethyl-substituted phenyl ring, an amide linkage, and an isoxazole ring with a methyl group.*
FDA Label Image

Chemical-structure-pharmacokinetics (Chemical Structure Pharmacoki)

Chemical-structure-pharmacokinetics (Chemical Structure Pharmacoki)
Chemical structure of Leflunomide (teriflunomide) showing its molecular composition including trifluoromethyl-substituted phenyl and cyano groups as labeled A77 1726.*
FDA Label Image
FDA Label Image

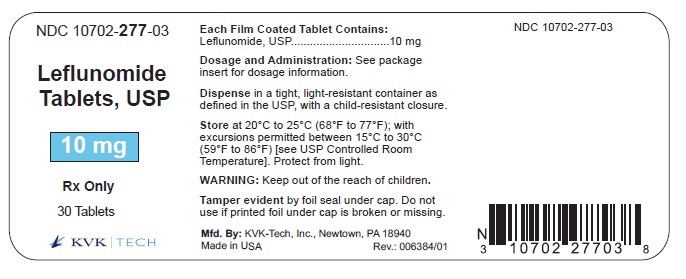
Container Label (10 mg)

Container Label (10 mg)
Leflunomide Tablets, USP 10 mg oral film-coated tablets label showing 30 tablets per container. The label includes dosing information, storage instructions at 20°C to 25°C with permitted excursions, and tamper-evident warning. Manufactured by KVK-Tech, Inc., Newtown, PA, USA, with NDC 10702-277-03.*
FDA Label Image

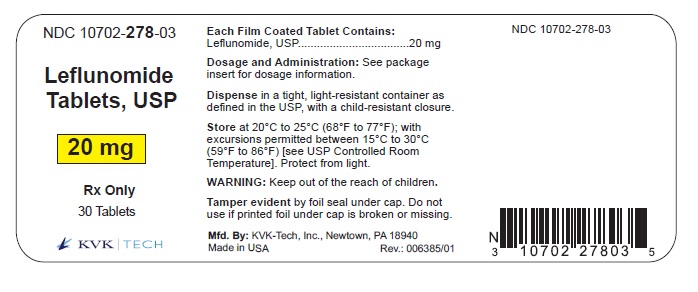
Container Label (20 mg)

Container Label (20 mg)
Leflunomide Tablets USP 20 mg film-coated tablets label from KVK-Tech, Inc. The label includes dosage strength, NDC number, storage instructions, warnings, and packaging details for a 30-count bottle. It specifies that the product is Rx only and contains tamper-evident features.*
FDA Label Image

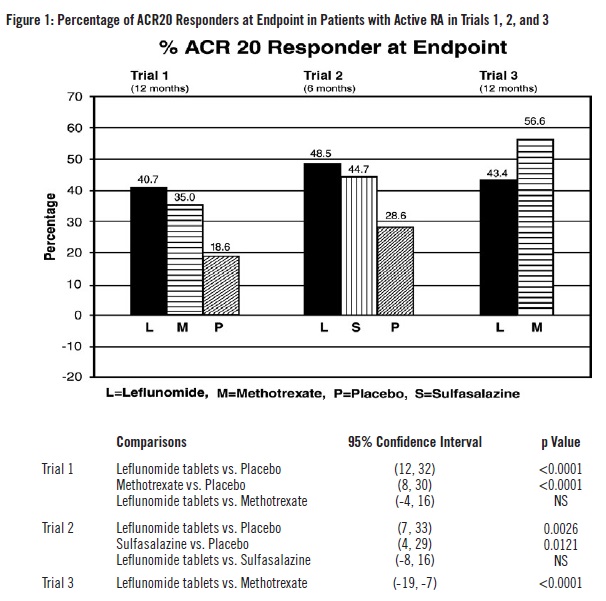
Figure 1 (Figure 1)

Figure 1 (Figure 1)
A bar chart titled 'Percentage of ACR20 Responders at Endpoint' showing results from three trials measuring response rates in patients with active rheumatoid arthritis. Percentages are compared among Leflunomide, Methotrexate, Placebo, and Sulfasalazine groups at 6 or 12 months. The chart includes corresponding confidence intervals and p-values for treatment comparisons, highlighting statistically significant differences except between Leflunomide and Methotrexate where noted as not significant.*
FDA Label Image

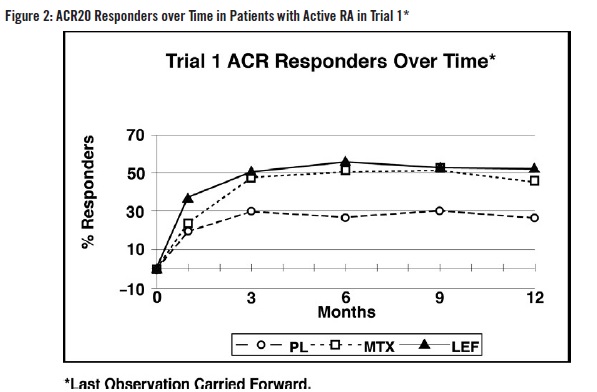
Figure 2 (Figure 2)

Figure 2 (Figure 2)
Line graph titled 'Trial 1 ACR Responders Over Time' showing the percentage of ACR20 responders in patients with active rheumatoid arthritis over 12 months. The x-axis represents time in months, and the y-axis represents the percentage of responders. Three lines represent different treatments: placebo (PL), methotrexate (MTX), and Leflunomide (LEF), with Leflunomide showing the highest response rate over time.*
FDA Label Image

Figure 3 (Figure 3)

Figure 3 (Figure 3)
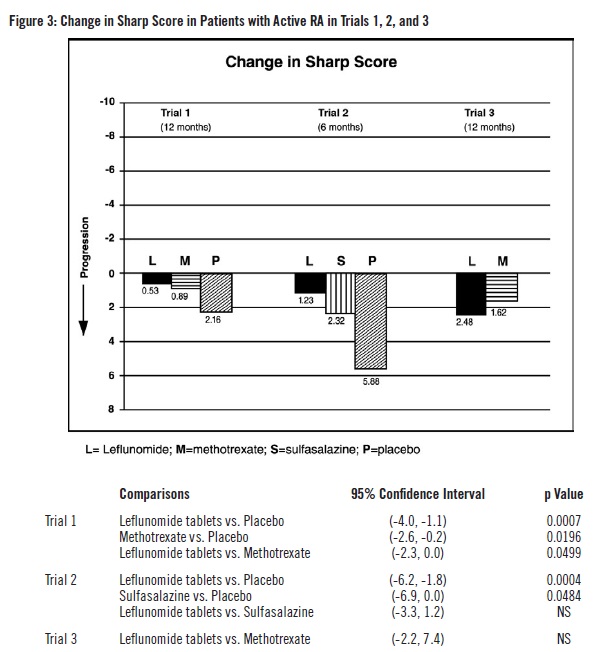
A bar chart titled 'Change in Sharp Score in Patients with Active RA in Trials 1, 2, and 3' showing progression and comparison among treatments Leflunomide (L), Methotrexate (M), Sulfasalazine (S), and Placebo (P). The chart includes data from three trials with time frames of 6 and 12 months, illustrating changes in Sharp scores for each treatment group. Below the chart, a table provides comparisons between treatments with 95% confidence intervals and p-values for Trials 1, 2, and 3.*
FDA Label Image

Figure 4 (Figure 4)

Figure 4 (Figure 4)
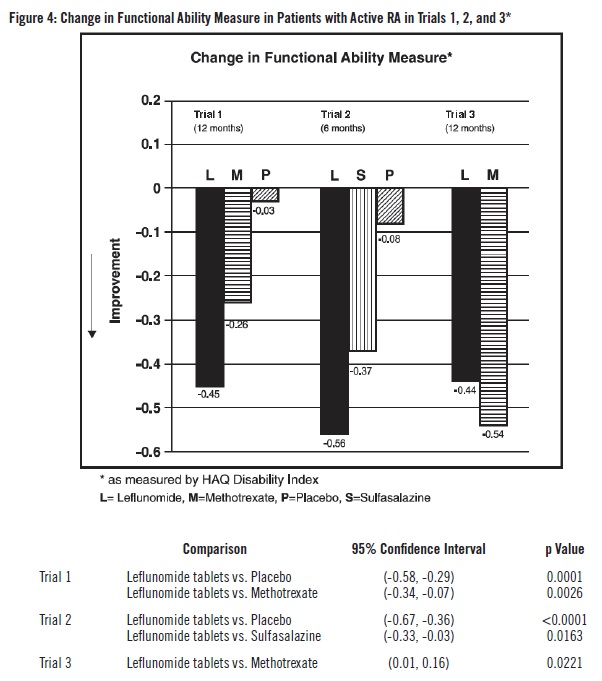
A bar chart displaying the change in functional ability measure in patients with active rheumatoid arthritis (RA) across three clinical trials of Leflunomide, Methotrexate, Placebo, and Sulfasalazine. The y-axis represents improvement measured by the HAQ Disability Index, with bars showing negative values indicating improvement over 6 to 12 months. The chart compares functional ability reductions for Leflunomide and other treatments in each trial, accompanied by a table with comparison data, 95% confidence intervals, and p-values.*
FDA Label Image

How Supplied (How Supplied)

How Supplied (How Supplied)
A data table listing Leflunomide tablets by strength and packaging. It details two strengths: 10 mg white, round, film-coated, biconvex tablets debossed with \"V55\" and 20 mg yellow, triangular, film-coated, biconvex tablets debossed with \"V56\". Each strength is packaged in a 30 count bottle with corresponding NDC numbers.*
FDA Label Image

Table 1 (Table 1)

Table 1 (Table 1)
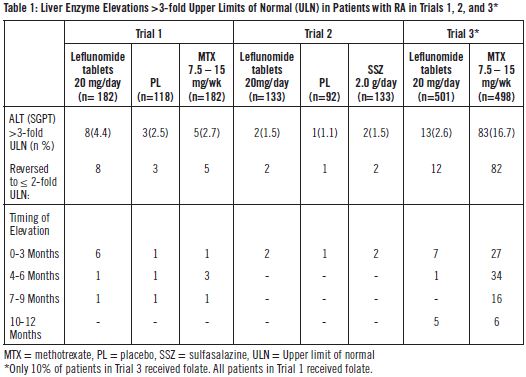
Table showing liver enzyme elevations greater than three-fold upper limits of normal in patients with rheumatoid arthritis across three clinical trials. It compares Leflunomide tablets 20 mg/day with methotrexate, placebo, and sulfasalazine, detailing ALT elevations, reversions, and timing of elevations over different months.*
FDA Label Image

Table 2 (Table 2)

Table 2 (Table 2)
A data table presenting the percentage of patients with adverse events greater than or equal to 5% in groups treated with leflunomide tablets compared to placebo, sulfasalazine, and methotrexate in rheumatoid arthritis studies. The table compares results from placebo-controlled and active-controlled trials, showing adverse event rates for leflunomide 20 mg/day and other treatments across multiple trials with patient counts.*
FDA Label Image

Table 3 (Table 3)

Table 3 (Table 3)
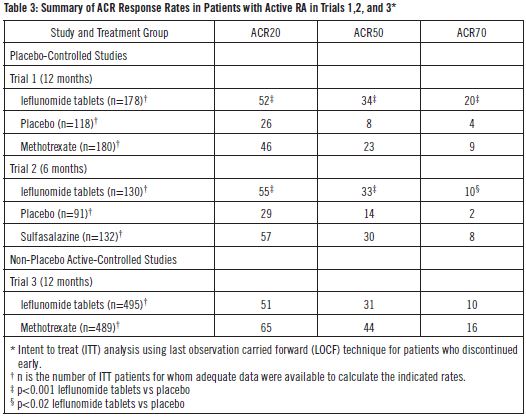
Data table summarizing ACR response rates in patients with active rheumatoid arthritis (RA) from trials 1, 2, and 3. It compares response rates (ACR20, ACR50, ACR70) among groups receiving leflunomide tablets, placebo, methotrexate, and sulfasalazine over 6 to 12 months, including patient numbers and statistical significance annotations.*
FDA Label Image

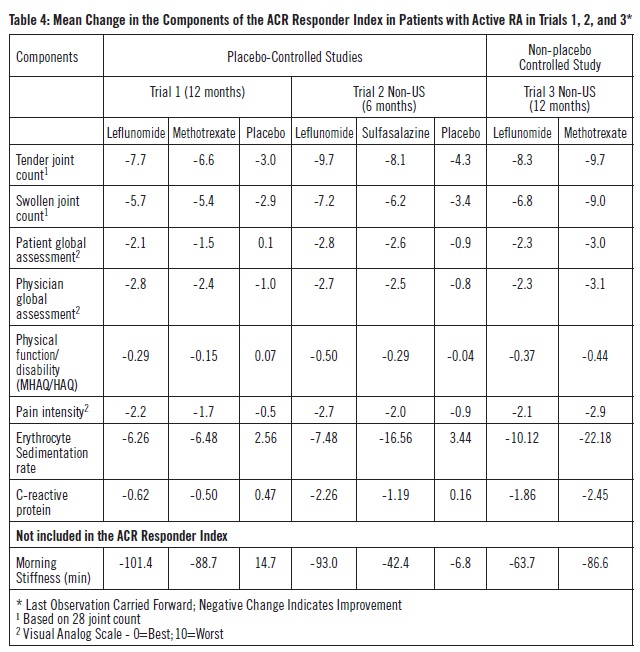
Table 4 (Table 4)

Table 4 (Table 4)
Data table presenting the mean change in components of the ACR Responder Index in patients with active rheumatoid arthritis. It compares Leflunomide, Methotrexate, Sulfasalazine, and Placebo across multiple trials (Trial 1, Trial 2 Non-US, and Trial 3 Non-US) on measures including tender joint count, swollen joint count, patient and physician global assessments, physical function/disability, pain intensity, erythrocyte sedimentation rate, C-reactive protein, and morning stiffness. Negative values indicate improvement.*

* About these descriptions: Image descriptions on this page are generated by automated AI analysis of the product label images from the manufacturer's FDA label submission (SPL). They are provided for reference only and may contain errors or omissions. Always rely on the printed label itself and the official FDA labeling, and consult a pharmacist or healthcare professional with any questions about this product.