Product Images Metformin Hydrochloride

View Photos of Packaging, Labels & Appearance

Product Label Images

The following 10 images provide visual information about the product associated with Metformin Hydrochloride NDC 12634-757 by Apotheca Inc., such as packaging, labeling, and the appearance of the drug itself. This resource could be helpful for medical professionals, pharmacists, and patients seeking to verify medication information and ensure they have the correct product.

label500 - 756 18

label500 - 756 18

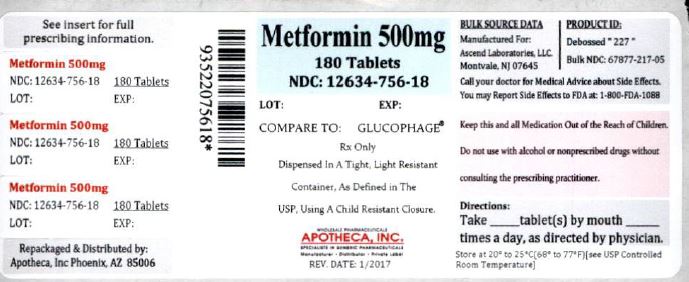
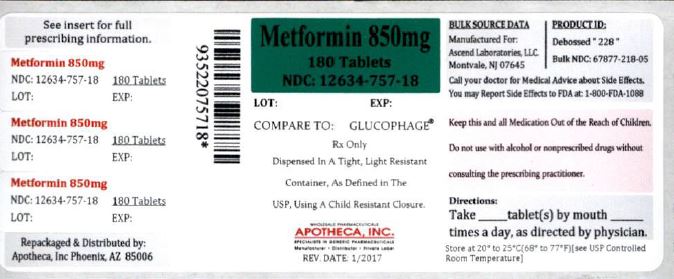
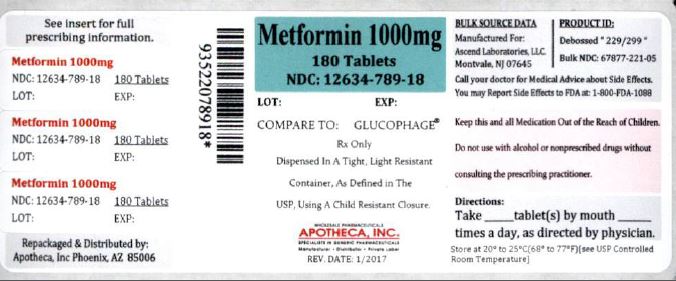
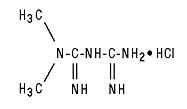
This is a medication called Metformin and it comes in a bottle of 180 tablets of 500mg. The lot and expiration date are also mentioned. It was packaged and distributed by Apotheca, Inc based in Phoenix, AZ. The product ID and NDC are also provided. Specific instructions for use are mentioned such as taking the tablet orally a certain number of times directed by the physician.*

label850 - 757 18

label850 - 757 18

This is a medication description of Metformin 850mg, which is packaged in 160 and 180 tablets with NDC numbers. The medication is re-packaged and distributed by Apotheca Inc. There are instructions on the container on how to take the medication, which should be directed by a physician. The text includes a lot number and some product identification details and a REV date of 1/201.*

label1000 - 789 18

label1000 - 789 18

This is a description of a medication called Metformin with a strength of 1000mg and 180 tablets per container. The NDC number is provided along with a lot number, expiration date, and instructions on how to take the medication. The medication is distributed by Apotheca, Inc, and the container is child-resistant. The text also provides a reference to Glucophage and contains a warning about the medication's effects on children. The medication should be stored at room temperature. The full prescribing information can be found on an insert.*

table1 - Table1

table1 - Table1

This text presents a table showing Metformin Pharmacokinetic Parameters in different groups of subjects who received various doses of Metformin Hydrochloride Tablets. The groups include healthy adults, elderly healthy adults, adults with type 2 diabetes, and renal-impaired adults. The table provides data on peak plasma concentration, time to peak plasma concentration, and other related parameters for each group.*

table2 - Table2

table2 - Table2

This is a table presenting the comparison between the effects of Metformin Hydrochloride tablets and placebo on fasting plasma glucose, HbA1, and body weight at the end of a 29-week study, and it shows the mean changes from baseline. FPG, HbA1, and Body Weight are the measures considered for the comparison, and the values for baseline and change at the final visit are given for Metformin Hydrochloride tablets and placebo. The p-value is also indicated for each measure, showing the statistical significance of the observed differences.*

table3 - Table3

table3 - Table3

This is a table from a 29-week study comparing the effects of Combined Metformin Hydrochloride Tablets /Glyburide (Comb) vs Glyburide (Glyb) or Metformin Hydrochloride Tablets (MET) Monotherapy. The table summarizes the mean changes from the baseline in fasting plasma glucose, HbAy, and body weight at the final visit. The study was conducted on 213 patients on Comb and 209 patients on Glyb. The table also includes p-values for the various comparisons. The Results suggest that Comb therapy improves fasting plasma glucose and HbAy compared to monotherapy with Glyb or Metformin. However, the difference in body weight was statistically non-significant. All the patients were on glyburide, 20 mg/day, at baseline.*

table4 - Table4

table4 - Table4

This text provides a summary table with mean percent changes from baseline of major serum lipid variables at final visit for Metformin hydrochloride tablets vs Placebo and Combined Metformin hydrochloride Tablets/Glyburide vs Monotherapy. However, the table is not fully readable due to the lack of data values and the format.*

table5 - Table5

table5 - Table5

This is a table summarizing the mean changes from baseline in HbA and daily insulin dose for patients who took combined Metformin Hydrochloride Tablets with insulin compared to those who took placebo with insulin. The table shows the baseline and final Hemoglobin Ay percentage and Insulin Dose per day for both treatment groups. The data suggest that the Metformin group had a statistically significant difference in Hemoglobin Ay compared to the Placebo group using analysis of covariance with baseline as a covariate. However, there was no significant difference in the analysis of variance results. The insulin dose was also statistically significant using analysis of covariance with the baseline as a covariate.*

Table6 - Table6

Table6 - Table6

Table 6 shows a summary of changes in plasma glucose and body weight in pediatric patients who took Metformin Hydrochloride Tablets compared to those who took Placebo. The table highlights the baseline and the final visit FPG (fasting plasma glucose) and Body Weight in mg/dL and lbs, respectively. The table also shows the p-value and NS+ value stating the statistical significance between the groups. The pediatric patients have a mean age of 13.8 years, with a range of 10 to 16 years. All patients were on diet therapy at the baseline.*

metformin structure - metformin struct

metformin structure - metformin struct

* The product label images have been analyzed using a combination of traditional computing and machine learning techniques. It should be noted that the descriptions provided may not be entirely accurate as they are experimental in nature. Use the information in this page at your own discretion and risk.