Figure 1
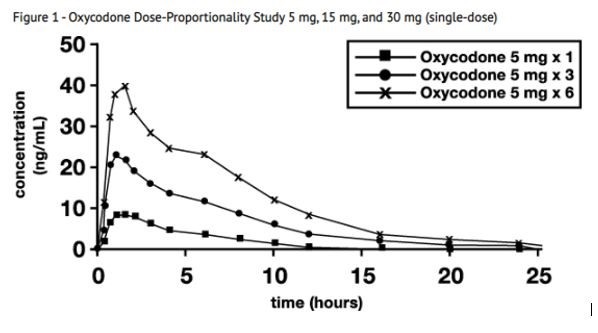
This is a Figure 1 of a study that evaluated the dose-proportionality of Oxycodone, using three different doses; 5mg, 15mg, and 30mg administered as a single dose. The figure shows a graph with time (hours) on the x-axis and the dose of Oxycodone (in miligrams) on the y-axis. The graph displays the plasma concentrations of Oxycodone for each dose at different time points. There are three lines on the graph, each representing one of the three doses tested.*