Gamunex-c Injection
Product Images NDC 13533-805

View Photos of Packaging, Regulatory Labels, and Product Appearance

Product Visual Gallery

This gallery contains 5 technical images submitted to the FDA as part of the official labeling for Gamunex-c (NDC 13533-805). Unlike standard consumer photos, these assets often include clinical data figures, molecular chemical structures, and official manufacturer packaging layouts.

As provided by Grifols Usa, Llc, these visuals offer a comprehensive scientific overview of the product's physical and chemical identity, aiding pharmacists and researchers in product verification and study.

FDA Label Image

Bag (Bag1)

Bag (Bag1)
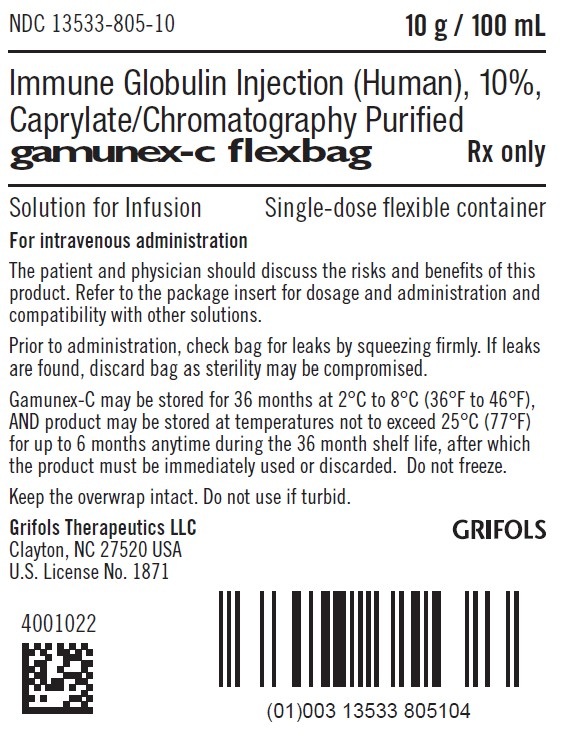
Gamunex-C 10 g/100 mL Immune Globulin Injection (Human), 10%, Caprylate/Chromatography Purified, in a single-dose flexible container for intravenous administration. The label includes storage instructions, manufacturer information Grifols Therapeutics LLC, and a barcode with NDC 13533-805-10. The product is Rx only.*
FDA Label Image

Carton (Carton1)

Carton (Carton1)
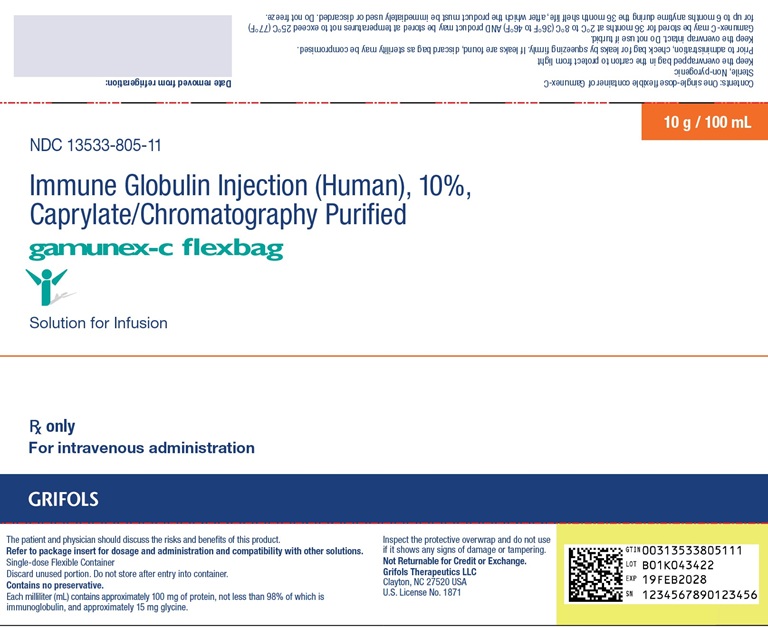
Gamunex-C flexbag Immune Globulin Injection (Human), 10 g/100 mL, Caprylate/Chromatography Purified, solution for infusion. The label shows it is Rx only and intended for intravenous administration. The product is distributed by Grifols Therapeutics LLC, with details including lot number, expiration date, and barcodes visible on the packaging label.*
FDA Label Image

Figure 1234 (Figure1234)

Figure 1234 (Figure1234)
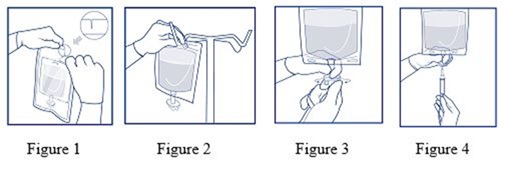
A four-panel instructional illustration showing the steps for preparing an intravenous infusion bag. Figure 1 depicts opening the bag's packaging, Figure 2 shows attaching tubing to the bag, Figure 3 illustrates opening the flow control valve, and Figure 4 shows inserting the tubing into the infusion port.*
FDA Label Image

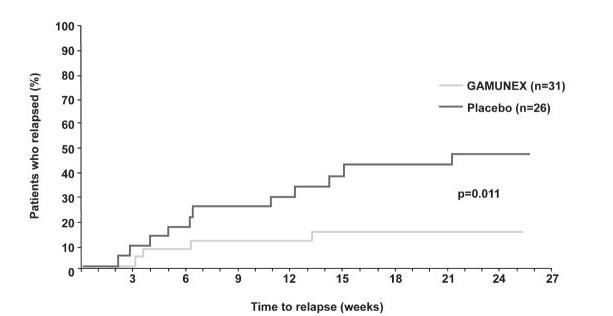
Figure 8: Outcome Of Randomized Withdrawal Period (Gamunex Img 01)

Figure 8: Outcome Of Randomized Withdrawal Period (Gamunex Img 01)
A Kaplan-Meier curve chart comparing the percentage of patients who relapsed over 27 weeks between Gamunex-C and placebo groups. The x-axis represents time to relapse in weeks, and the y-axis shows the percentage of patients who relapsed. The graph indicates fewer relapses in the Gamunex-C group compared to placebo, with a p-value of 0.011.*
FDA Label Image

* About these descriptions: Image descriptions on this page are generated by automated AI analysis of the product label images from the manufacturer's FDA label submission (SPL). They are provided for reference only and may contain errors or omissions. Always rely on the printed label itself and the official FDA labeling, and consult a pharmacist or healthcare professional with any questions about this product.