Rabeprazole Sodium Tablet, Delayed Release
Product Images NDC 13668-107

View Photos of Packaging, Regulatory Labels, and Product Appearance

Product Visual Gallery

This gallery contains 7 technical images submitted to the FDA as part of the official labeling for Rabeprazole Sodium (NDC 13668-107). Unlike standard consumer photos, these assets often include clinical data figures, molecular chemical structures, and official manufacturer packaging layouts.

As provided by Torrent Pharmaceuticals Limited, these visuals offer a comprehensive scientific overview of the product's physical and chemical identity, aiding pharmacists and researchers in product verification and study.

FDA Label Image

Structure (4d1e141f 24d6 41e0 A671 48ff69147297 01)
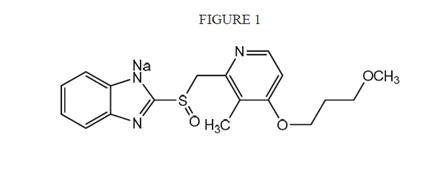
Structure (4d1e141f 24d6 41e0 A671 48ff69147297 01)
Chemical structure diagram of Rabeprazole sodium, showing its molecular framework including a sodium atom, sulfur, oxygen, nitrogen atoms, and methoxy and methyl groups as part of the compound.*
FDA Label Image

Figure 2 (4d1e141f 24d6 41e0 A671 48ff69147297 02)

Figure 2 (4d1e141f 24d6 41e0 A671 48ff69147297 02)
Line graph showing mean daytime heartburn scores over study days for placebo and Rabeprazole 10 mg and 20 mg groups. The y-axis represents mean heartburn scores (0 to 4 scale), and the x-axis represents study days from -14 to 28. The graph illustrates score trends before and after day 0 for each group.*
FDA Label Image

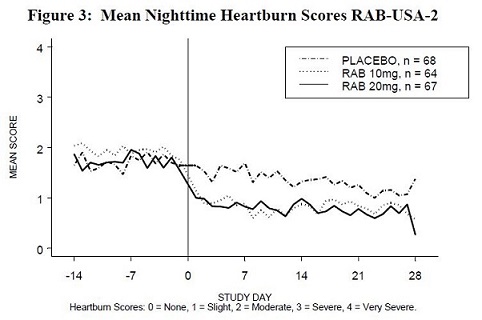
Figure 3 (4d1e141f 24d6 41e0 A671 48ff69147297 03)

Figure 3 (4d1e141f 24d6 41e0 A671 48ff69147297 03)
A line graph titled 'Mean Nighttime Heartburn Scores RAB-USA-2' showing mean heartburn scores over time from 14 days before to 28 days after the start of a study. The graph compares three groups: placebo, rabeprazole 10 mg, and rabeprazole 20 mg. The y-axis shows mean score values from 0 to 4, representing heartburn severity, and the x-axis shows study days from -14 to 28.*
FDA Label Image

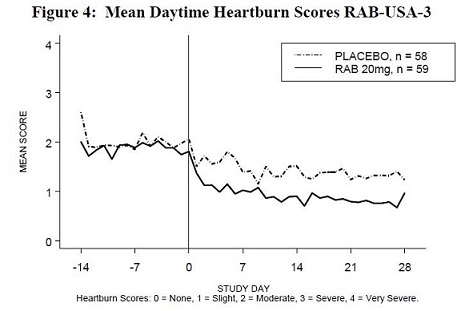
Figure 4 (4d1e141f 24d6 41e0 A671 48ff69147297 04)

Figure 4 (4d1e141f 24d6 41e0 A671 48ff69147297 04)
Line chart titled 'Mean Daytime Heartburn Scores RAB-USA-3' comparing heartburn scores over a 28-day study period between a placebo group and a Rabeprazole 20 mg group. The x-axis represents study days from -14 to 28, and the y-axis shows mean heartburn scores from 0 (none) to 4 (very severe). The graph depicts a trend of decreasing scores in the Rabeprazole 20 mg group.*
FDA Label Image

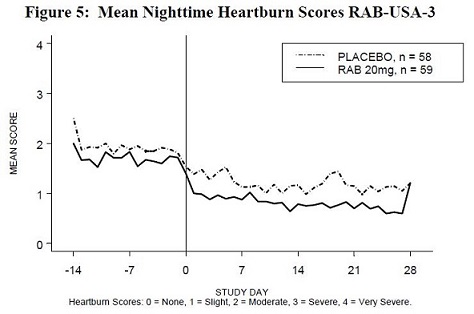
Figure 5 (4d1e141f 24d6 41e0 A671 48ff69147297 05)

Figure 5 (4d1e141f 24d6 41e0 A671 48ff69147297 05)
Line graph titled 'Mean Nighttime Heartburn Scores RAB-USA-3' comparing mean heartburn scores over a 28-day study period between a placebo group (n=58) and a group treated with Rabeprazole sodium 20 mg (n=59). The vertical axis shows mean scores from 0 to 4, and the horizontal axis indicates study days from -14 to 28. The graph illustrates decreasing heartburn scores in the Rabeprazole group compared to placebo during the treatment period.*
FDA Label Image

Logo (4d1e141f 24d6 41e0 A671 48ff69147297 06)

FDA Label Image

1 (4d1e141f 24d6 41e0 A671 48ff69147297 07)

1 (4d1e141f 24d6 41e0 A671 48ff69147297 07)
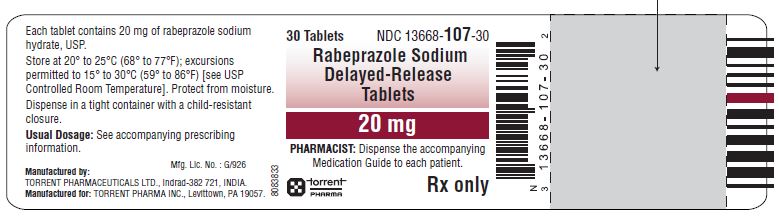
Label for Rabeprazole Sodium Delayed-Release Tablets, 20 mg strength, in a 30-count package. The label includes storage instructions, dosage form, and manufacturer details for Torrent Pharmaceuticals Limited. It displays the product NDC 13668-107-30 and indicates prescription-only use.*

* About these descriptions: Image descriptions on this page are generated by automated AI analysis of the product label images from the manufacturer's FDA label submission (SPL). They are provided for reference only and may contain errors or omissions. Always rely on the printed label itself and the official FDA labeling, and consult a pharmacist or healthcare professional with any questions about this product.