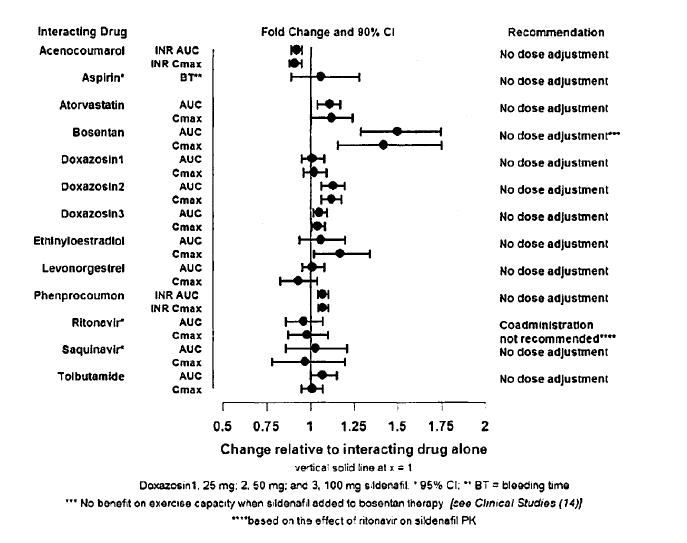
2 (55aa9711 6df5 4516 Bf00 A1acf7f7a464 01)

This text appears to be a chart showing estimated cumulative mortality rates at different doses over time. The doses are labeled as high dose, medium dose, and low dose, with corresponding percentages of estimated cumulative mortality rates given for each dose at different time intervals. However, the chart seems incomplete and lacks information to provide a full context.*