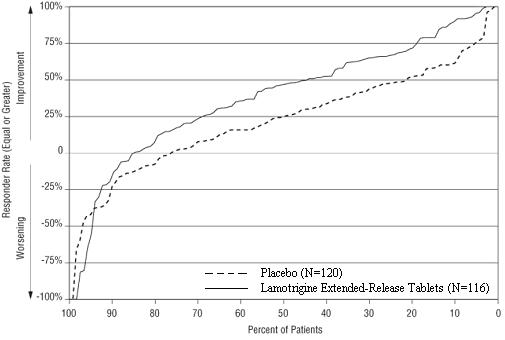
Image Clinicalstudy1 Partialonsetseizure
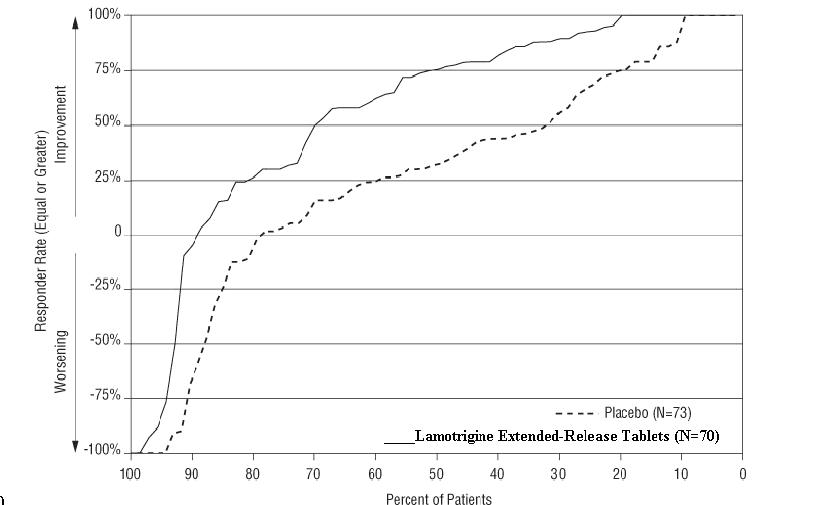
This is a statistical graph that shows the responder rates of patients who took Lamotrigine Extended-Release Tablets compared to a placebo. The vertical axis measures improvement or worsening in percentages, ranging from -50% to 75%. The horizontal axis shows the percentage of patients who experienced improvement or worsening. The graph also displays two data points, one at 75% improvement for Lamotrigine and one at -100% worsening for the placebo group. The remaining text is too fragmented to provide a clear description.*