Esomeprazole Magnesium Granule, Delayed Release
Product Images NDC 13668-548

9 FDA label images from Torrent Pharmaceuticals Limited · Packaging, Regulatory Labels, and Product Appearance

Product Visual Gallery

This gallery contains 9 technical images submitted to the FDA as part of the official labeling for Esomeprazole Magnesium (NDC 13668-548). Unlike standard consumer photos, these assets often include clinical data figures, molecular chemical structures, and official manufacturer packaging layouts.

As provided by Torrent Pharmaceuticals Limited, these visuals offer a comprehensive scientific overview of the product's physical and chemical identity, aiding pharmacists and researchers in product verification and study.

FDA Label Image

Image (Structure)

Image (Structure)
Chemical structure of Esomeprazole Magnesium. The image depicts the molecular arrangement including two esomeprazole moieties complexed with a magnesium ion (Mg2+). The diagram highlights functional groups such as methoxy (OCH3) and sulfoxide, showing the compound's two aromatic rings and chemical bonds.*
FDA Label Image

Image2 (Figure 1)

Image2 (Figure 1)
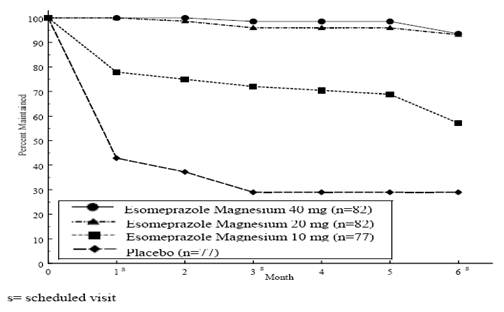
A line graph depicting the percent of participants maintaining a condition over six months for Esomeprazole Magnesium in 40 mg, 20 mg, and 10 mg doses versus placebo. The x-axis represents months, and the y-axis shows the percent maintained. Separate lines illustrate results for each dosage and placebo groups.*
FDA Label Image

Image3 (Figure 2)

Image3 (Figure 2)
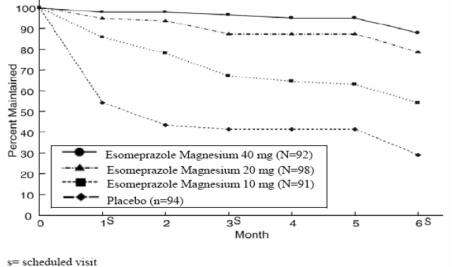
A line graph depicting percent maintained over a 6-month period for Esomeprazole Magnesium at doses of 10 mg, 20 mg, and 40 mg compared with placebo. The x-axis represents the months with scheduled visits, and the y-axis shows percent maintained, illustrating the decline trends for each group over time.*
FDA Label Image

Image Description (Figure 3)

Image Description (Figure 3)
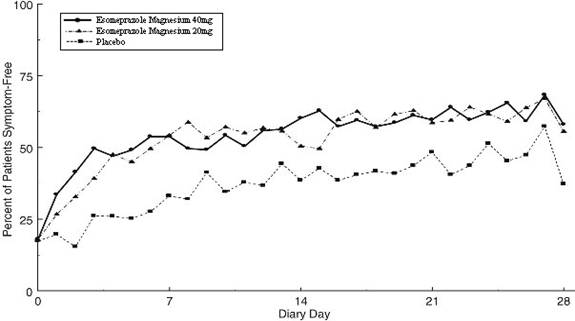
A line graph comparing the percent of patients symptom-free over 28 diary days for Esomeprazole Magnesium 40 mg, 20 mg, and placebo groups. The x-axis represents diary days from 0 to 28, and the y-axis shows the percent of patients symptom-free ranging from 0 to 100%. Data points for the three groups are plotted with distinct line styles and markers.*
FDA Label Image

Image Description (Figure 4)

Image Description (Figure 4)
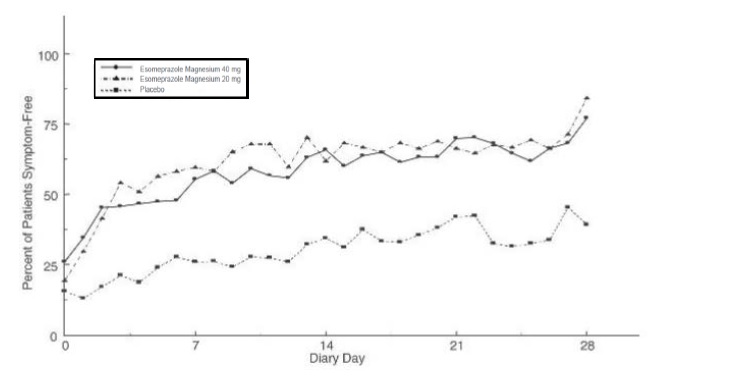
A line chart showing the percent of patients symptom-free over a 28-day diary period. It compares Esomeprazole Magnesium 40 mg, 20 mg, and placebo, with symptom-free rates generally higher for the Esomeprazole groups than placebo across the days.*
FDA Label Image

Image (Logo2)

FDA Label Image

Image (Logo1)

FDA Label Image

Sachet (Esomeprazolesachet10mg)

FDA Label Image

Carton (Esomeprazolecarton10mg)

* About these descriptions: Image descriptions on this page are generated by automated AI analysis of the product label images from the manufacturer's FDA label submission (SPL). They are provided for reference only and may contain errors or omissions. Always rely on the printed label itself and the official FDA labeling, and consult a pharmacist or healthcare professional with any questions about this product.