Liraglutide Injection, Solution
Product Images NDC 14403-3400

View Photos of Packaging, Regulatory Labels, and Product Appearance

Product Visual Gallery

This gallery contains 27 technical images submitted to the FDA as part of the official labeling for Liraglutide (NDC 14403-3400). Unlike standard consumer photos, these assets often include clinical data figures, molecular chemical structures, and official manufacturer packaging layouts.

As provided by Hybio Pharmaceutical Co., Ltd. (pingshan Factory), these visuals offer a comprehensive scientific overview of the product's physical and chemical identity, aiding pharmacists and researchers in product verification and study.

FDA Label Image

Figure 1 Structural Formula Of Liraglutide (Figure 1)
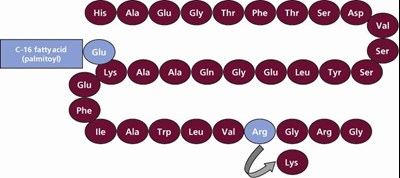
Figure 1 Structural Formula Of Liraglutide (Figure 1)
Chemical structure schematic of Liraglutide showing its amino acid sequence as labeled spheres, including additions such as a C-16 palmitoyl fatty acid chain linked to a glutamic acid residue. The sequence is depicted in a curved layout indicating the peptide's structure.*
FDA Label Image

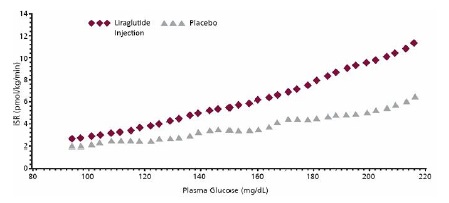
Figure 2 (Figure 2)

Figure 2 (Figure 2)
A line graph comparing beta-cell function (Bf, pmol/kg/min) versus plasma glucose (mg/dL) levels for Liraglutide Injection and Placebo. The graph shows Liraglutide Injection represented by maroon diamonds and Placebo by gray triangles, illustrating Bf values increasing with higher plasma glucose levels.*
FDA Label Image

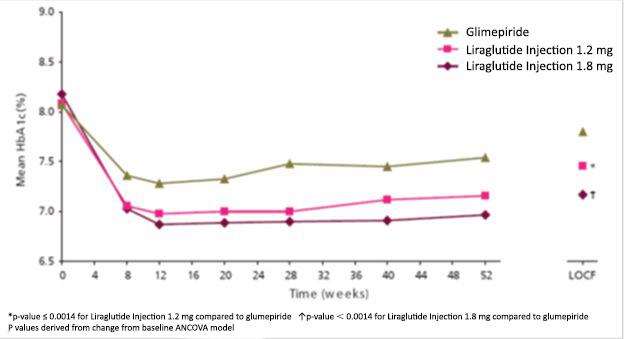
Figure 3 (Figure 3)

Figure 3 (Figure 3)
A line graph depicting mean HbA1c percentage over 52 weeks comparing Glimepiride with Liraglutide Injection at 1.2 mg and 1.8 mg doses. The x-axis represents time in weeks, while the y-axis shows mean HbA1c percentages from 6.5% to 9.0%. Both Liraglutide doses show a decline in HbA1c initially, remaining lower than Glimepiride throughout the period.*
FDA Label Image

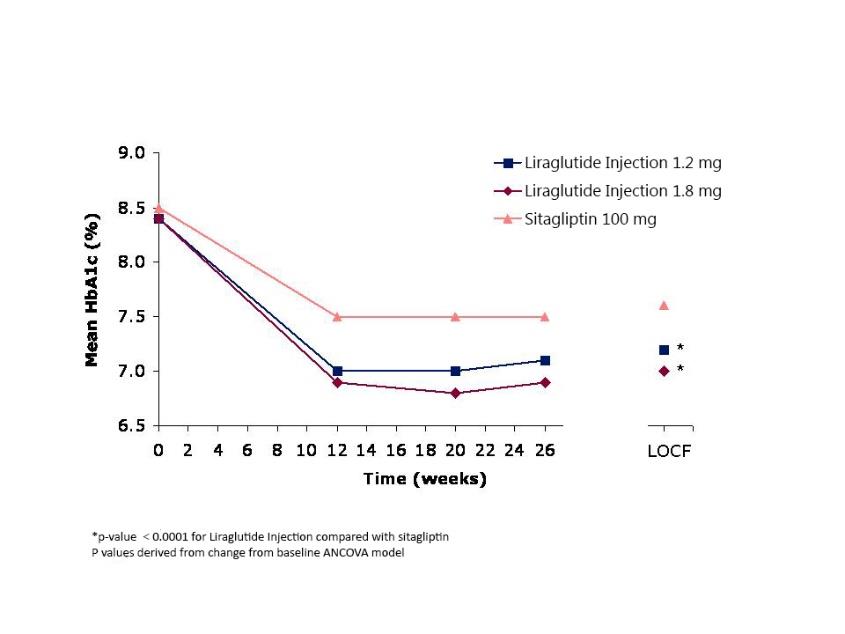
Figure 4 (Figure 4)

Figure 4 (Figure 4)
A line graph showing mean HbA1c (%) over time (weeks) for Liraglutide Injection at doses of 1.2 mg and 1.8 mg, compared to Sitagliptin 100 mg. The graph tracks changes from week 0 to week 26 with both Liraglutide doses showing a greater reduction in HbA1c than Sitagliptin.*
FDA Label Image

Liraglutide Injection Carton Label For Three (Liraglutide Injection Carton Label Three Syringes)

Liraglutide Injection Carton Label For Three (Liraglutide Injection Carton Label Three Syringes)
Carton packaging label for Liraglutide Injection 18 mg/3 mL (6 mg/mL) subcutaneous injection by Hybio Pharmaceutical Co., Ltd. The label shows an image of a blue prefilled pen and indicates a package size of 3 pens. The label includes dosing information, storage instructions to refrigerate and not freeze, and manufacturer and distributor details. The brand Hikma is also mentioned on the label.*
FDA Label Image

Liraglutide Injection (Pen)

Liraglutide Injection (Pen)
An instructional diagram of the Liraglutide Injection Pen, showing labeled parts including the pen cap, rubber stopper, cartridge trip, cartridge scale, cartridge, dose selector, dose display, pointer, dose button, and flow check symbol. An example needle assembly is also depicted, with outer needle cap, inner needle cap, needle, and protective tap labeled.*
FDA Label Image

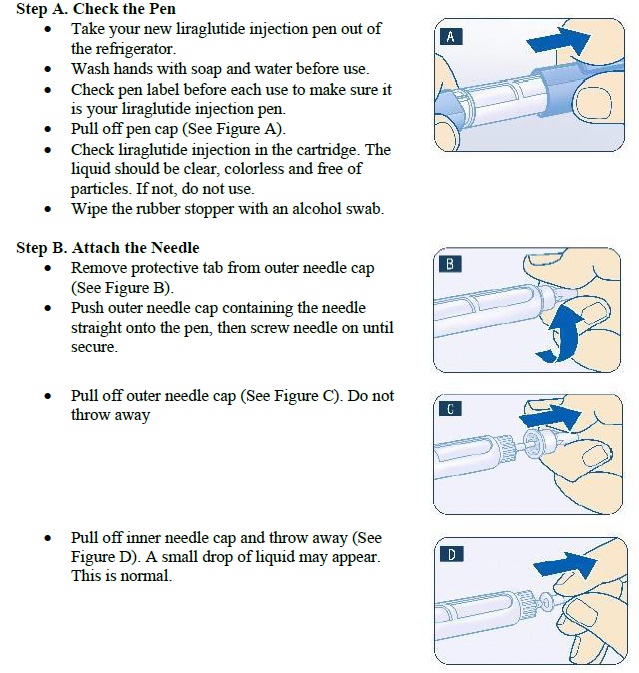
Stepa-b (Step A B)

Stepa-b (Step A B)
Instructional diagrams and text detailing the steps for preparing a liraglutide injection pen for use. Includes steps to check the pen, remove the pen cap, attach the needle by screwing it on securely, and remove the outer and inner needle caps, with small blue arrow illustrations showing each action.*
FDA Label Image

Stepc (Step C)

Stepc (Step C)
An instructional diagram showing a step for using a liraglutide injection pen. It illustrates dialing the dose selector to align the black line with the flow check symbol. The diagram highlights the flow check symbol selected on the pen and explains this step is done once per new pen to prepare it for use.*
FDA Label Image

Stepd (Step D)

Stepd (Step D)
Illustration showing Step D of preparing a liraglutide injection pen. It includes an image of a hand tapping the pen cartridge with needle pointing up to remove air bubbles, and another image demonstrating pressing the dose button until the black 0 mg line aligns with the pointer. Instructions emphasize ensuring a drop of liraglutide appears at the needle tip before use.*
FDA Label Image

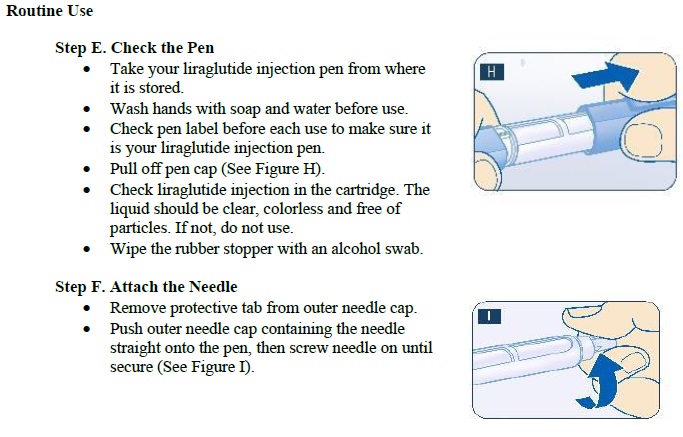
Stepe-f (Step E F)

Stepe-f (Step E F)
An instructional diagram showing steps to prepare a liraglutide injection pen for use. Step E illustrates checking the pen, removing the cap, and verifying the clear liquid inside the cartridge. Step F demonstrates attaching the needle by removing the protective tab and screwing the needle onto the pen. The images highlight hand movements and pen handling.*
FDA Label Image

Stepend (Step End)

Stepend (Step End)
Text panel providing instructions for proper disposal of used liraglutide injection pens and needles. It advises using an FDA-cleared sharps disposal container or a suitable household container meeting specific criteria. It also mentions following community guidelines for disposal and warns against reusing or sharing needles and disposing of sharps containers in household trash unless permitted.*
FDA Label Image

Stepend2 (Step End2)

Stepend2 (Step End2)
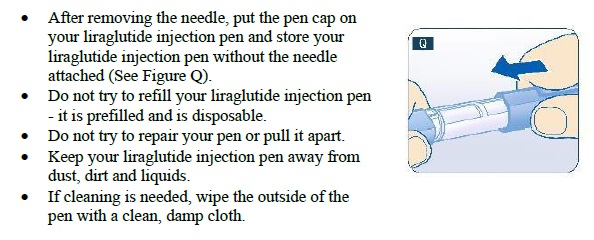
An instructional diagram showing how to remove the needle from a liraglutide injection pen, place the pen cap back on, and store the pen without the needle attached. The instructions emphasize that the pen is prefilled, disposable, should not be refilled or repaired, and should be kept away from dust and liquids. Cleaning involves wiping the pen with a clean, damp cloth.*
FDA Label Image

Stepg (Step G)

Stepg (Step G)
Instructional diagram showing steps to prepare and dial the dose of Liraglutide injection pen. Illustrations depict removing outer and inner needle caps and using the dose selector to set doses of 0.6 mg, 1.2 mg, or 1.8 mg, with visual aids for correct dose alignment and selection.*
FDA Label Image

Steph (Step H)

Steph (Step H)
An instructional diagram detailing Step H for injecting the dose of liraglutide injection. It shows a hand pressing down the center of the dose button on the injection pen until the dose display aligns with the 0 mg mark, accompanied by written instructions on proper injection sites and technique.*
FDA Label Image

Stepi-j (Step I J)

Stepi-j (Step I J)
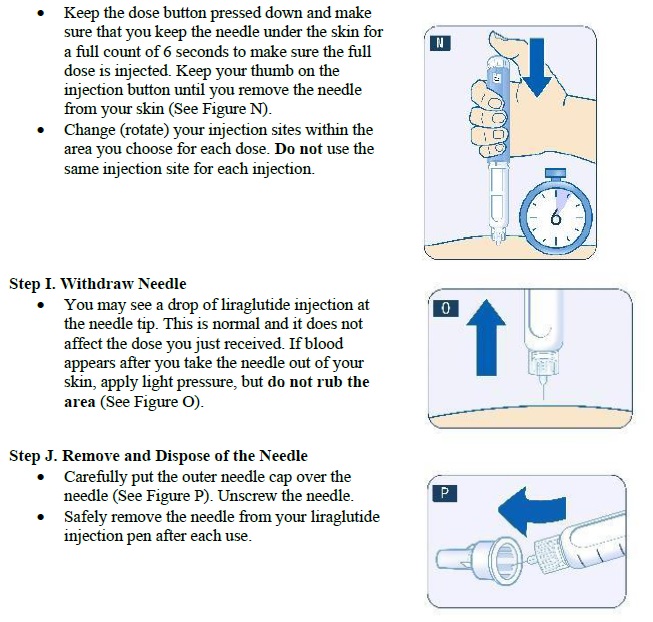
Instructional illustrations for the injection process of liraglutide solution, 18 mg/3 mL. The images show a hand holding the injection pen pressed against skin with a 6-second timer, withdrawal of the needle straight out from the skin, and removal of the needle from the injection pen with an arrow indicating unscrewing. The diagrams guide users on proper injection technique and needle disposal.*
FDA Label Image

Table 1 Adverse Reactions Reported In ≥ 5% Of Adult Patients Treated With Liraglutide Injection For Type 2 (Table 1)

Table 1 Adverse Reactions Reported In ≥ 5% Of Adult Patients Treated With Liraglutide Injection For Type 2 (Table 1)
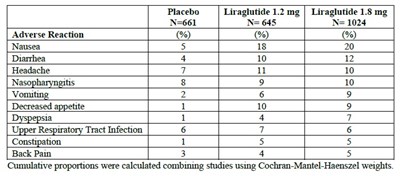
A data table comparing the percentage incidence of adverse reactions among subjects treated with placebo, Liraglutide 1.2 mg, and Liraglutide 1.8 mg. Adverse reactions listed include nausea, diarrhea, headache, nasopharyngitis, vomiting, decreased appetite, dyspepsia, upper respiratory tract infection, constipation, and back pain, with counts of subjects for each group indicated.*
FDA Label Image

Table 10 (Table 10)

Table 10 (Table 10)
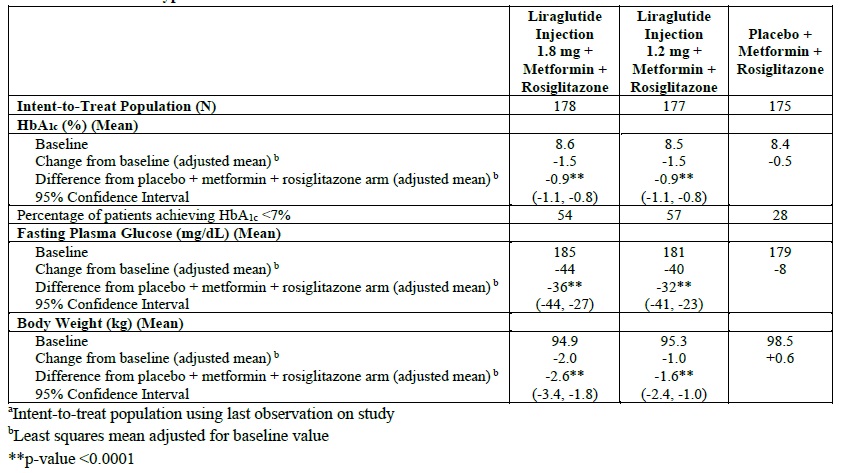
A data table presenting mean values for HbA1c (%), fasting plasma glucose (mg/dL), and body weight (kg) in an intent-to-treat population comparing liraglutide injection (1.8 mg and 1.2 mg) plus metformin and rosiglitazone, and placebo plus metformin and rosiglitazone. It includes baseline values, changes from baseline, differences versus placebo, and confidence intervals.*
FDA Label Image

Table 11 (Table 11)

Table 11 (Table 11)
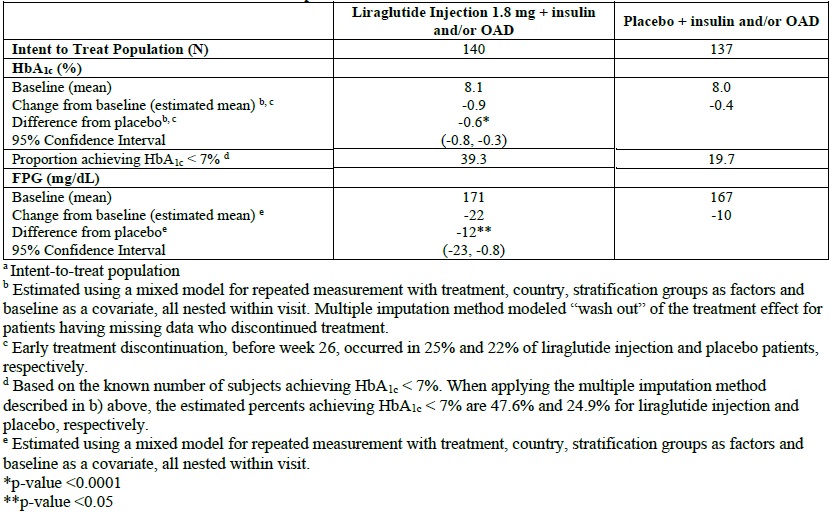
A clinical data table comparing Liraglutide Injection 1.8 mg + insulin and/or OAD versus placebo + insulin and/or OAD. It presents baseline means, change from baseline, differences from placebo, 95% confidence intervals for HbA1c percentages, proportion achieving HbA1c <7%, and fasting plasma glucose (FPG) values, with annotations for statistical significance and study population details.*
FDA Label Image

Table 12 (Table 12)

Table 12 (Table 12)
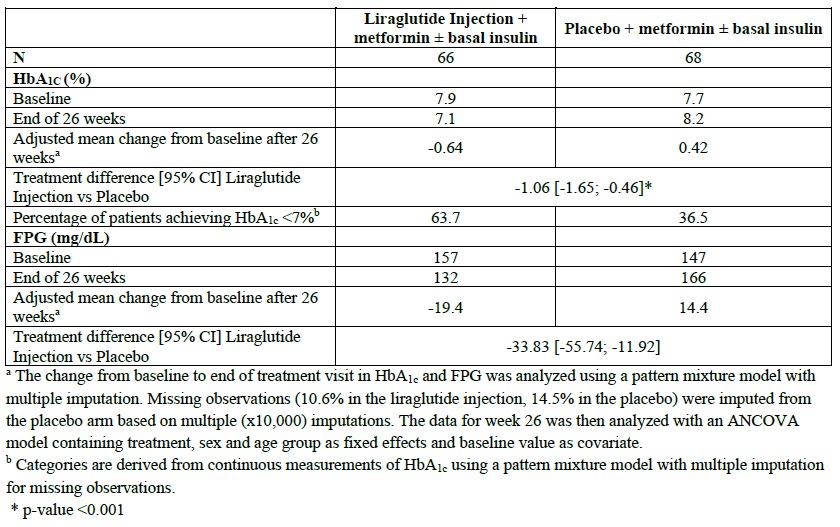
A data table comparing Liraglutide Injection plus metformin with or without basal insulin versus placebo plus metformin with or without basal insulin. The table shows sample size, HbA1c percentages at baseline and after 26 weeks, adjusted mean changes from baseline, treatment differences with confidence intervals, and percentages of patients achieving HbA1c below 7%. Fasting plasma glucose (FPG) values are also detailed with baseline, 26-week values, and treatment differences. Footnotes explain statistical methods and significance.*
FDA Label Image

Table 2 Adult Incidence (%) And Rate (episodes/patient Year) Of Hypoglycemia In 26-week Combination Therapy Placebo-controlled Trials (Table 2)

Table 2 Adult Incidence (%) And Rate (episodes/patient Year) Of Hypoglycemia In 26-week Combination Therapy Placebo-controlled Trials (Table 2)
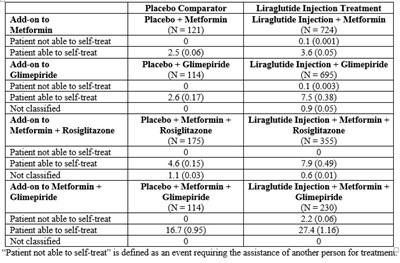
A comparative data table showing patient ability to self-treat using Liraglutide Injection Treatment versus Placebo comparator in combination with Metformin, Glimepiride, and Rosiglitazone. It includes percentages and counts of patients able or unable to self-treat across different treatment groups.*
FDA Label Image

Table 3 (Table 3)

Table 3 (Table 3)
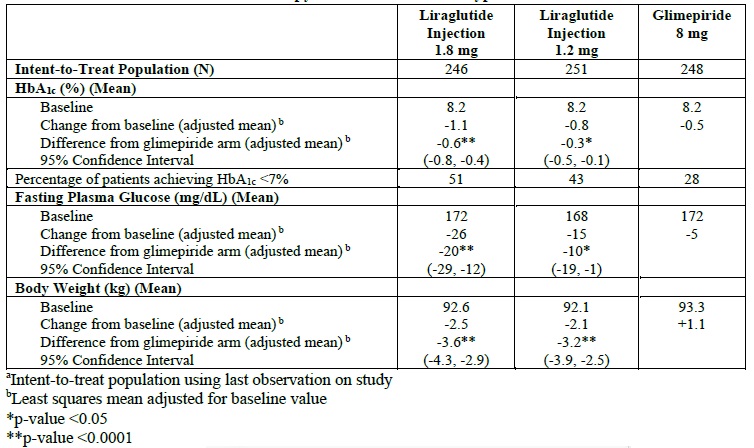
A comparative data table showing clinical study results for Liraglutide Injection at 1.8 mg and 1.2 mg strengths versus Glimepiride 8 mg. The table presents mean values for HbA1c percentage, fasting plasma glucose (mg/dL), and body weight (kg) among intent-to-treat populations, including baseline values, changes from baseline, differences from glimepiride arms, and 95% confidence intervals with statistical significance markers.*
FDA Label Image

Table 4 (Table 4)

Table 4 (Table 4)
A data table comparing the effects of Liraglutide injection (1.8 mg and 1.2 mg combined with metformin), placebo plus metformin, and glimepiride plus metformin on hemoglobin A1c, fasting plasma glucose, and body weight. The table includes baseline means, changes from baseline, differences between groups, and 95% confidence intervals for an intent-to-treat population.*
FDA Label Image

Table 5 (Table 5)

Table 5 (Table 5)
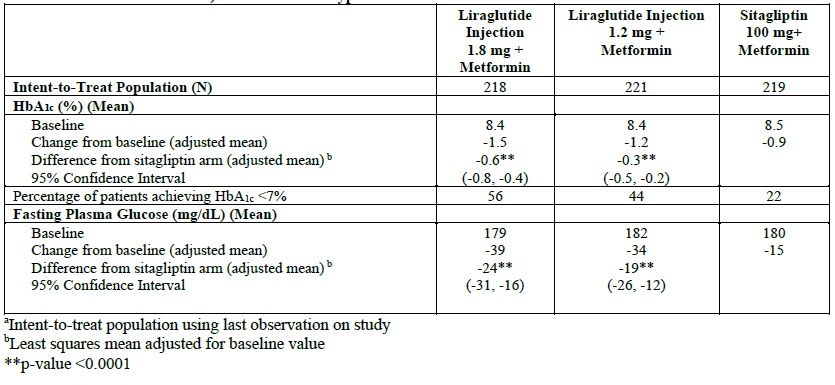
A data table comparing clinical results for Liraglutide Injection 1.8 mg + Metformin, Liraglutide Injection 1.2 mg + Metformin, and Sitagliptin 100 mg + Metformin. It includes intent-to-treat population numbers and mean values for HbA1c (%) and fasting plasma glucose (mg/dL), showing baseline, change from baseline, differences from sitagliptin arm, and 95% confidence intervals.*
FDA Label Image

Table 6 (Table 6n)

Table 6 (Table 6n)
A data table comparing clinical results between two treatment groups: Insulin detemir + Liraglutide Injection + Metformin versus Liraglutide Injection + Metformin. It includes metrics such as baseline and change in HbA1c (%) means, percentage of patients achieving HbA1c <7%, and fasting plasma glucose (mg/dL) means, with statistical significance annotations and confidence intervals.*
FDA Label Image

Table 7 (Table 7)

Table 7 (Table 7)
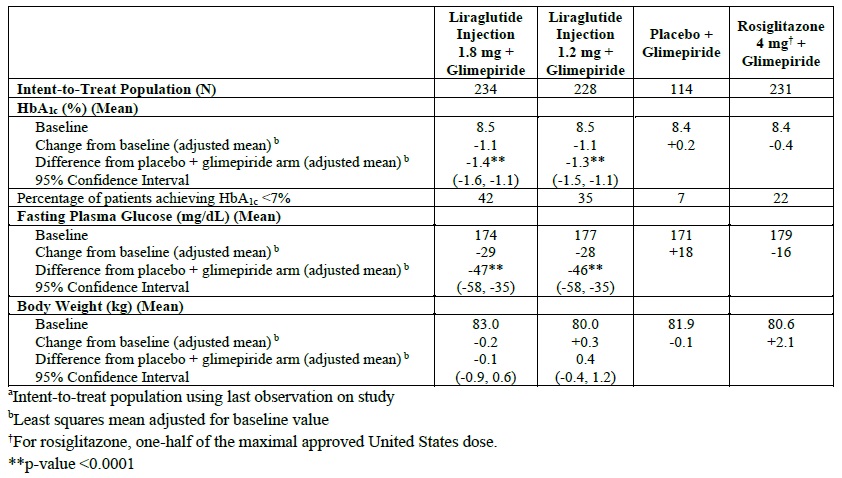
A data table presenting clinical study results comparing treatment effects on HbA1c levels, fasting plasma glucose, and body weight among groups using Liraglutide injection plus Glimepiride, placebo plus Glimepiride, and Rosiglitazone plus Glimepiride. The table includes baseline values, adjusted mean changes from baseline, differences from placebo plus Glimepiride arm, and 95% confidence intervals for each parameter.*
FDA Label Image

Table 8 (Table 8)

Table 8 (Table 8)
A data table presenting clinical study results comparing Liraglutide Injection 1.8 mg plus Metformin and Glimepiride to Placebo plus Metformin and Glimepiride, and Insulin glargine plus Metformin and Glimepiride. Parameters include mean HbA1c percentage, fasting plasma glucose (mg/dL), and body weight (kg) at baseline and changes from baseline, with statistical significance and confidence intervals noted.*
FDA Label Image

Table 9 (Table 9)

Table 9 (Table 9)
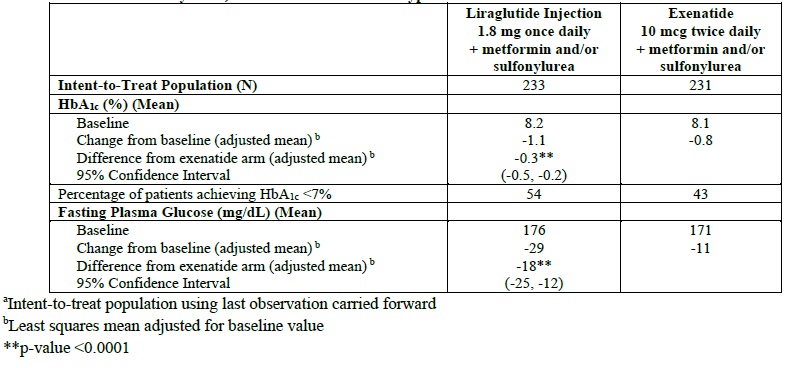
A data table comparing Liraglutide Injection (1.8 mg once daily) with Exenatide (10 mcg twice daily), both combined with metformin and/or sulfonylurea. It presents mean baseline and changes in HbA1c (%) and fasting plasma glucose (mg/dL) for intent-to-treat populations, including differences between the two treatments, confidence intervals, and percentage of patients achieving HbA1c <7%.*

* About these descriptions: Image descriptions on this page are generated by automated AI analysis of the product label images from the manufacturer's FDA label submission (SPL). They are provided for reference only and may contain errors or omissions. Always rely on the printed label itself and the official FDA labeling, and consult a pharmacist or healthcare professional with any questions about this product.