Figure1 (Darifenacin Fig1)
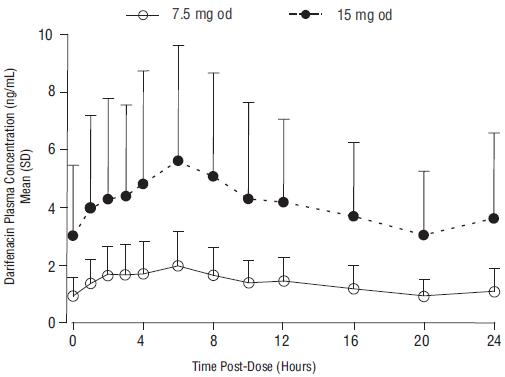
This appears to be a graph or chart showing two lines labeled "75mgod" and "15mgod" with the X-axis labeled as "Time Post-Dose (Hours)" and the Y-axis labeled as "WL g\g\q I 1" and markers at 0, 4, 8, 12, 16, 20, and 24 hours. Without further context or information, it is not possible to provide a useful description.*