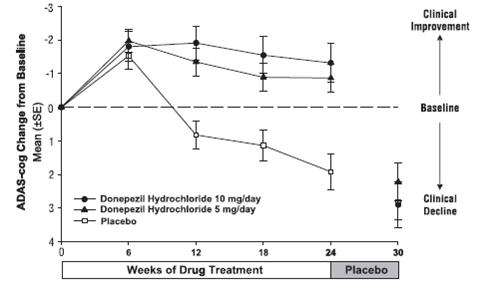
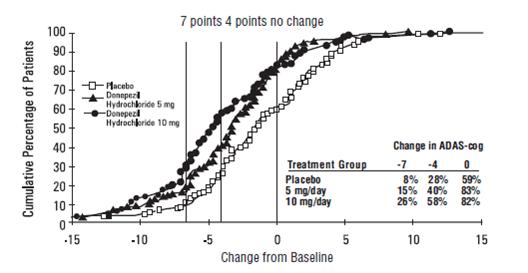
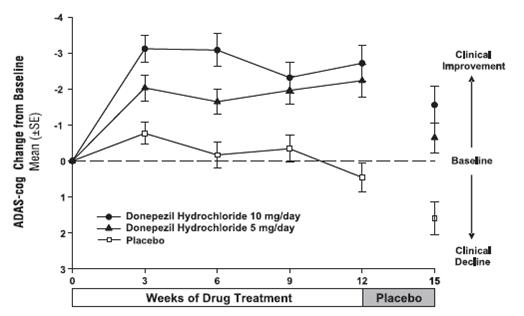
Figure 1. Time-course Of The Change From Baseline In Adas-cog Score For Patients Completing 24 Weeks Of Treatment. (Donepezil Fig1)
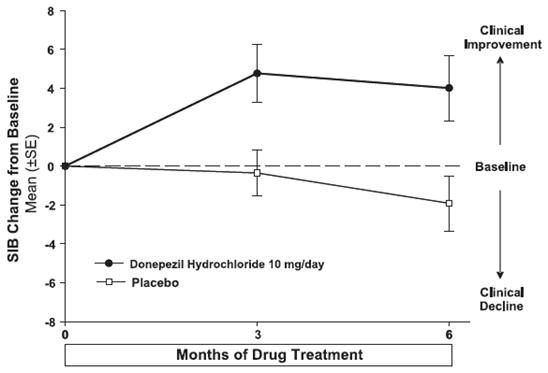
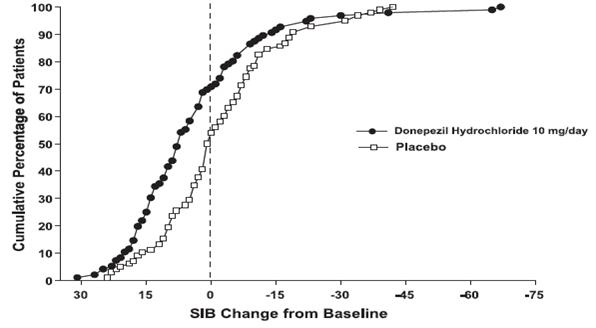
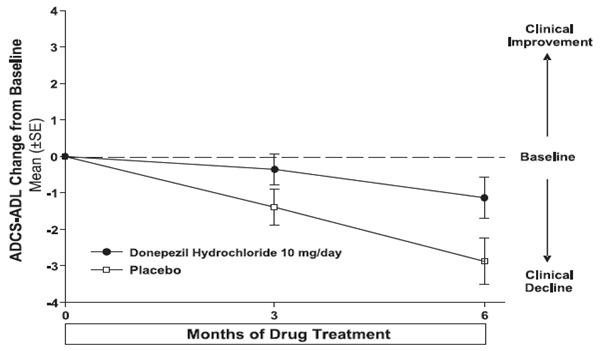
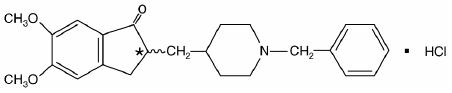
This gallery contains 16 technical images submitted to the FDA as part of the official labeling for Donepezil Hydrochloride (NDC 16571-778). Unlike standard consumer photos, these assets often include clinical data figures, molecular chemical structures, and official manufacturer packaging layouts.
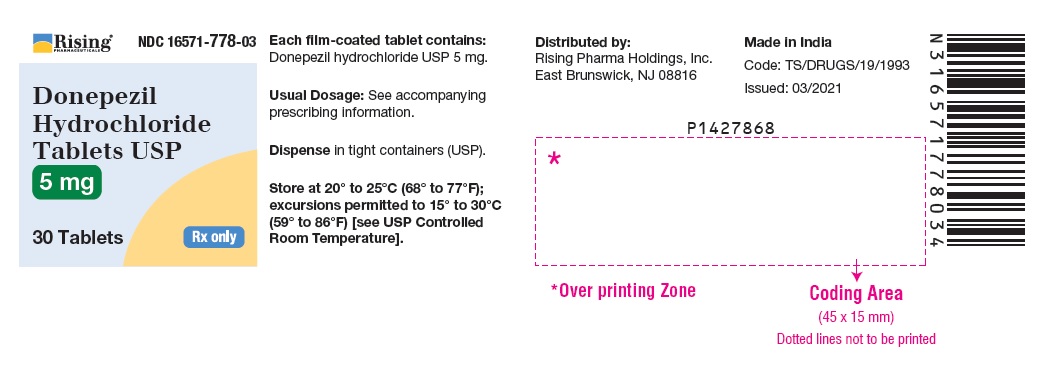
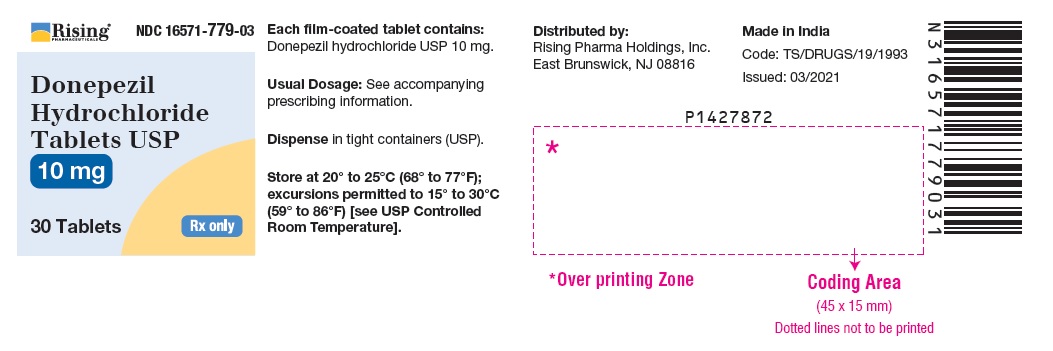
As provided by Rising Pharma Holdings, Inc., these visuals offer a comprehensive scientific overview of the product's physical and chemical identity, aiding pharmacists and researchers in product verification and study.
* These product label images have been analyzed using experimental machine learning. Please verify findings with the primary label text.