Product Images Sirolimus

View Photos of Packaging, Labels & Appearance

Product Label Images

The following 30 images provide visual information about the product associated with Sirolimus NDC 16571-806 by Rising Pharma Holdings, Inc., such as packaging, labeling, and the appearance of the drug itself. This resource could be helpful for medical professionals, pharmacists, and patients seeking to verify medication information and ensure they have the correct product.

Table-1.jpg - Table 1

Table-1.jpg - Table 1

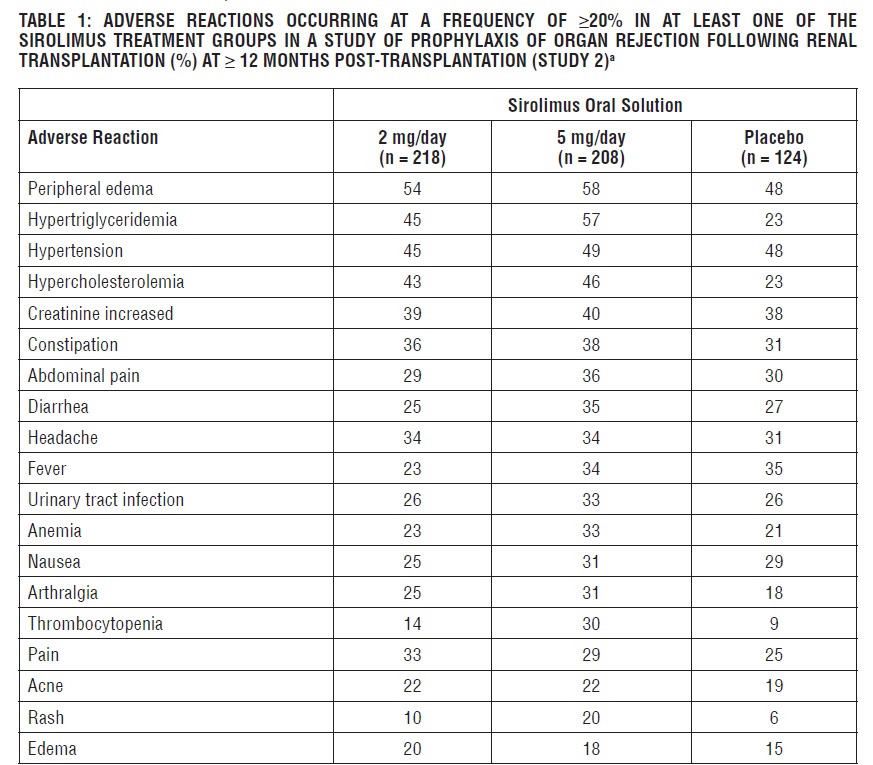
This is a table showing the adverse reactions occurring at a frequency of more than 20% in at least one of the Sirolimus treatment groups in a study of prophylaxis of organ rejection following renal transplantation. Some of the notable adverse reactions include peripheral edema, hypertriglyceridemia, hypertension, hypercholesterolemia, constipation, and diarrhea, among others. The table provides the percentage of occurrence for each adverse reaction in different treatment groups, such as Sirolimus Oral Solution at 2 mg/day, 5 mg/day, and a Placebo group.*

Table-10.jpg - Table 10

Table-10.jpg - Table 10

This text provides a comparison of graft and patient survival percentages for two different studies involving Sirolimus oral solution, Sirolimus oral solution with Azathioprine, and Placebo over different time periods such as 12, 24, and 36 months. Study 1 includes 284 participants for Sirolimus oral solution, 274 for Sirolimus oral solution with Azathioprine, and 161 for Placebo. Study 2 includes 227 participants for Sirolimus oral solution, 219 for Sirolimus oral solution with Azathioprine, and 130 for Placebo. Graft and patient survival rates are shown for each group at the specified time points.*

Table-11.jpg - Table 11

Table-11.jpg - Table 11

This data presents the percentage of efficacy failure by race at 6 months for different treatments, including sirolimus oral solution, azathioprine, and a placebo. The table provides information on efficacy failure rates for both Black and Non-Black individuals in two separate studies. The percentages of efficacy failure vary based on the treatment and race group, offering insights into the effectiveness of the various treatments among different racial demographics.*

Table-12.jpg - Table 12

Table-12.jpg - Table 12

This is a table showing the overall calculated glomerular filtration rates (mean + SEM, cc/min) of patients using Sirolimus Oral Solution, Sirolimus Oral Solution with Azathioprine, and Placebo at different dosages over different time intervals post-transplant. Data is presented for two studies, with measurements taken at Month 12, 24, and 36. Each group size (n) is also provided for reference.*

Table-13.jpg - Table 13

Table-13.jpg - Table 13

This data table presents the graft and patient survival rates for two different treatment groups in Study 3°. The study compared the outcomes of patients receiving Sirolimus with Cyclosporine to those receiving Sirolimus following Cyclosporine withdrawal. Graft survival percentages are shown at months 12, 24, and 36, while patient survival percentages are displayed at the same time points. The table provides insights into the effectiveness of the two treatment strategies in terms of both graft and patient survival over a 36-month period.*

Table-14.jpg - Table 14

Table-14.jpg - Table 14

This text appears to show data related to the effectiveness of Sirolimus compared to Cyclosporine therapy and withdrawal in a study involving 215 participants. It includes measurements of certain parameters before and after randomization at different time points up to 36 months. The table provides valuable insights into the impact of these treatments over the study period.*

Table-15.jpg - Table 15

Table-15.jpg - Table 15

This is a table presenting the calculated glomerular filtration rates in mL/min at 12, 24, and 36 months post-transplant for two groups: one receiving Sirolimus with Cyclosporine therapy and the other receiving Sirolimus following Cyclosporine withdrawal. The mean values along with standard error of the mean (SEM) are shown for each time point and treatment group. The sample sizes for each group are also indicated.*

Table-16.jpg - Table 16

Table-16.jpg - Table 16

This text presents data on the efficacy failure rate, graft loss or death rate, and average glomerular function rates at 12 months post-transplant for a study involving 224 participants who received Sirolimus with Cyclosporine and Corticosteroids. The efficacy failure rate was 23.2%, the graft loss or death rate was 9.8%, and the mean glomerular function rate was 52.6 mL/min with a standard error of 1.6 mL/min.*

Table-17.jpg - Table 17

Table-17.jpg - Table 17

This is a table presenting data on renal function in stable renal transplant patients from a study comparing patients who converted to sirolimus with those who continued calcineurin inhibitors. The table shows the Glomerular Filtration Rate (GFR) in mL/min determined by Nankivell at 1 year and 2 years post-conversion or continuation. The results suggest minor differences in GFR between the two groups at both time points.*

Table-18.jpg - Table 18

Table-18.jpg - Table 18

The table presents data on the mean and median values for urinary protein to creatinine ratio (mg/mg) between treatment groups at baseline, 1 year, and 2 years in the stratum with baseline calculated GFR >40 mL/min. It shows the values for the Sirolimus Conversion group and the CNI Continuation group at different time points, along with the number of participants, mean, standard deviation, median, and p-values for comparison. The results suggest differences in urinary protein to creatinine ratio between the two groups over the study period.*

Table-2.jpg - Table 2

Table-2.jpg - Table 2

The table provides data on the incidence of malignancies in two studies (Study 1 and Study 2) post-transplantation. It compares the occurrence of different types of malignancies in patients taking Sirolimus Oral Solution, Azathioprine, and Placebo over 24 and 36 month periods. The table includes the percentage of malignancies such as Lymphoma, lymphoproliferative diseases, Skin Carcinoma (Squamous Cell, Basal Cell), and Melanoma. It also lists a category for Miscellaneous/Not Specified malignancies and provides a total percentage for each study. Other malignancies are also mentioned in the table.*

Table-3.jpg - Table 3

Table-3.jpg - Table 3

This text presents the incidence of malignancies in an evaluation study at 36 months post-transplant. The study compares the rates of different types of cancers in patients who underwent either Sirolimus therapy following Cyclosporine withdrawal or were non-randomized in their treatment. The data includes percentages for lymphoma/lymphoproliferative disease, skin carcinomas (such as squamous cell, basal cell, and melanoma), as well as miscellaneous or unspecified malignancies. This information can be used to assess the impact of different treatment approaches on the development of malignancies in transplant recipients.*

Table-4.jpg - Table 4

Table-4.jpg - Table 4

This text provides information on multiple dose (daily dose) of Solution Tablets. It includes values for Coux (ng/nL), e, AUC (ng*h/mL), Cous (ng/mL), and CLIF (mL/hkg). These values can be used for analyzing and monitoring medication dosages and their effects.*

Table-5.jpg - Table 5

Table-5.jpg - Table 5

This text provides a table showing the sirolimus whole blood trough concentrations observed in renal transplant patients enrolled in phase 3 studies. It includes data on different patient treatments, mean concentrations, and percentiles at both year 1 and year 3. The study categorizes patients based on their risk level and the specific medication regimen they receive. The concentrations vary depending on the treatment, with different percentiles reported for each category.*

Table-6.jpg - Table 6

Table-6.jpg - Table 6

This is a table showing the pharmacokinetic parameters of sirolimus in pediatric renal transplant patients. The table includes data such as age range, number of patients, body weight, mean concentration values, and clearance values for different age groups (6-11 and 12-18 years old). The information provides insights into the distribution and metabolism of sirolimus in this specific patient population.*

Table-7.jpg - Table 7

Table-7.jpg - Table 7

This is a table showing the pharmacokinetic parameters of sirolimus in pediatric patients with end-stage kidney disease who are maintained on hemodialysis or peritoneal dialysis. It includes information on different age groups, number of patients, time of elimination, and clearance per unit body weight.*

Table-8.jpg - Table 8

Table-8.jpg - Table 8

This is a table showing the incidence (%) of efficacy failure at 6 and 24 months for Study 12® comparing Sirolimus Oral Solution 2 mg/day and Sirolimus Oral Solution 5 mg/day with Azathioprine 2-3 mg/kg/day. The table provides information on the components of efficacy failure which include biopsy-proven acute rejection, graft loss, death, and patients lost to follow-up at both time points. At 6 months, the efficacy failure rates for the three groups were 18.7%, 16.8%, and 32.3% respectively, while at 24 months the rates were 32.8%, 25.9%, and 36%. Biopsy-proven acute rejection was the most common reason for efficacy failure at both time points.*

Table-9.jpg - Table 9

Table-9.jpg - Table 9

This is a table showing the incidence (%) of efficacy failure at 6 and 36 months for Study 2 comparing Sirolimus Oral Solution (2 mg/day and 5 mg/day) with a Placebo group. The table details the components of efficacy failure including biopsy-proven acute rejection, graft loss, death, and patients lost to follow-up at both time points. This data provides insights into the effectiveness of Sirolimus Oral Solution in preventing these adverse outcomes in the study participants.*

sirolimus-figure.jpg - sirolimus figure

sirolimus-figure.jpg - sirolimus figure

This text provides data on the FEV (forced expiratory volume) in liters for a specific treatment phase and observation phase involving the drug Sirolimus and a placebo. The table shows the number of subjects for each group at different time points during the study.*

sirolimus1.jpg - sirolimus1

sirolimus1.jpg - sirolimus1

sirolimus2.jpg - sirolimus2

sirolimus2.jpg - sirolimus2

sirolimus3.jpg - sirolimus3

sirolimus3.jpg - sirolimus3

sirolimus4.jpg - sirolimus4

sirolimus4.jpg - sirolimus4

sirolimus5.jpg - sirolimus5

sirolimus5.jpg - sirolimus5

sirolimus6.jpg - sirolimus6

sirolimus6.jpg - sirolimus6

sirolimus7.jpg - sirolimus7

sirolimus7.jpg - sirolimus7

sirolimus8.jpg - sirolimus8

sirolimus8.jpg - sirolimus8

sirolimusinnercarton.jpg - sirolimusinnercarton

sirolimusinnercarton.jpg - sirolimusinnercarton

sirolimusoutercarton.jpg - sirolimusoutercarton

sirolimusoutercarton.jpg - sirolimusoutercarton

This is a description of Sirolimus Oral Solution, a medication meant for oral use only. Each mL of the solution contains 1 mg of sirolimus, with additional ingredients such as ethanol, propylene glycol, phosphatidylcholine, and polysorbate 80. The solution comes in a 60 mL patient kit and must be stored refrigerated between 2° to 8°C (36° to 46°F). It is important to protect it from light, use the contents within one month after opening, and keep it out of reach of children. The text also mentions instructions for use, dosage, and storage details, along with manufacturer information indicating that it is made in India by Rising Pharma Holdings, Inc.*

sirolimusstruct.jpg - sirolimusstruct

sirolimusstruct.jpg - sirolimusstruct

* The product label images have been analyzed using a combination of traditional computing and machine learning techniques. It should be noted that the descriptions provided may not be entirely accurate as they are experimental in nature. Use the information in this page at your own discretion and risk.