Crixivan
Product Images NDC 16590-064

View Photos of Packaging, Regulatory Labels, and Product Appearance

Product Visual Gallery

This gallery contains 9 technical images submitted to the FDA as part of the official labeling for Crixivan (NDC 16590-064). Unlike standard consumer photos, these assets often include clinical data figures, molecular chemical structures, and official manufacturer packaging layouts.

As provided by Stat Rx Usa Llc, these visuals offer a comprehensive scientific overview of the product's physical and chemical identity, aiding pharmacists and researchers in product verification and study.

FDA Label Image

Crixivan 400 mg Label Image (Crixivan 400 mg Label 16590)

Crixivan 400 mg Label Image (Crixivan 400 mg Label 16590)
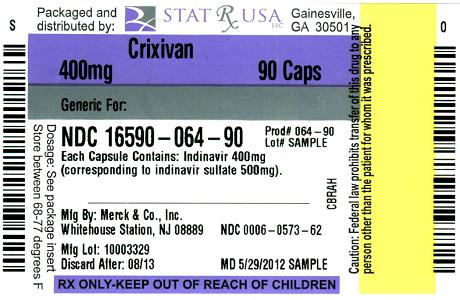
This is a description of a medication named Indinavir. The medication comes in capsule form with each containing 400mg of Indinavir (500mg as Indinavir sulfate). The packaging and manufacturer information indicate that it was produced and packaged in Gainesville, USA by JSA and distributed by Merck & Co Inc. The NDC code for the medication is 1659006490, and it includes a lot number of 10003329 and an expiration date of 08/13. The remaining text is not readable and contains some non-English characters.*
FDA Label Image

Image Of Indinavir Sulfate Chemical Structure (Crixivan 01)

FDA Label Image

Image Of Study Actg 320 Figure 1 (Crixivan 02)

Image Of Study Actg 320 Figure 1 (Crixivan 02)
This appears to be a chart or graph showing the proportion of patients using different drug combinations (IDV+ZDV+L versus ZDV+L) at different study weeks. The numbers on the x-axis represent the study week, while the numbers on the y-axis represent the proportion of patients. The numbers above the chart may represent the total number of patients in each group.*
FDA Label Image

Image Of Study Actg 320 Figure 2 (Crixivan 03)

FDA Label Image

Image Of Study 028 Figure 3 (Crixivan 04)

Image Of Study 028 Figure 3 (Crixivan 04)
This appears to be a table showing the proportions of patients in a study receiving different treatments (1DV + ZDV, Indinavir + Zidovudine, or Indinavir or Zidovudine alone) over the course of 48 weeks. The percentages range from 0.2 to 0.6 and correspond to different study weeks. The number of patients included in the study is also provided.*
FDA Label Image

Image Of Study 028 Figure 4 (Crixivan 05)

Image Of Study 028 Figure 4 (Crixivan 05)
This appears to be a chart or graph displaying data related to a study involving the drugs Indinavir and Zidovudine. The numbers likely relate to the dosage or effectiveness of the drugs at various points during the study. Without additional context, it is difficult to provide more specific information.*
FDA Label Image

Image Of Study 035 Figure 5 (Crixivan 06)

FDA Label Image

Image Of Study 035 Figure 6 (Crixivan 07)

FDA Label Image

Image Of Study 035 Figure 7 (Crixivan 08)

Image Of Study 035 Figure 7 (Crixivan 08)
The text appears to be a representation of a medical study using Indinavir in combination with Zidovudine and Lamivudine. The table includes data on the number of study participants and their results over a 24 week period. Without additional context, it is unclear what the specific findings of the study were.*

* These product label images have been analyzed using experimental machine learning. Please verify findings with the primary label text.