Megace Es
Product Images NDC 16590-254

5 FDA label images from Stat Rx Usa · Packaging, Regulatory Labels, and Product Appearance

Product Visual Gallery

This gallery contains 5 technical images submitted to the FDA as part of the official labeling for Megace Es (NDC 16590-254). Unlike standard consumer photos, these assets often include clinical data figures, molecular chemical structures, and official manufacturer packaging layouts.

As provided by Stat Rx Usa, these visuals offer a comprehensive scientific overview of the product's physical and chemical identity, aiding pharmacists and researchers in product verification and study.

FDA Label Image

Graph Image (Megacees Graph)
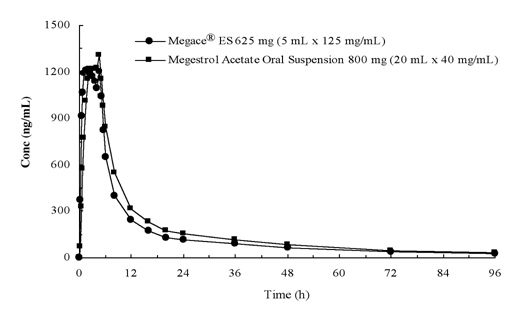
Graph Image (Megacees Graph)
A pharmacokinetic curve comparing the concentration (ng/mL) over time (hours) of Megace ES 625 mg (5 mL at 125 mg/mL) and Megestrol Acetate Oral Suspension 800 mg (20 mL at 40 mg/mL). The graph shows concentration decreasing from a peak towards zero over a 96-hour period.*
FDA Label Image

Label Image (Megacees Label)

Label Image (Megacees Label)
Megace ES 625 mg/5 mL oral suspension in a 150 mL bottle, labeled as a generic for 125 mg of Megestrol acetate per mL. Distributed by Stat Rx USA, Gainesville, GA. Manufactured by Par Pharmaceutical Co., Inc., Spring Valley, NY. Includes NDC 16590-254-33 and cautionary information about possible side effects such as dizziness and nausea. Contains lot and expiration details and a barcode for scanning.*
FDA Label Image

Structure Image (Megacees Struct)

Structure Image (Megacees Struct)
Chemical structure of megestrol acetate, USP, as a detailed molecular diagram showing its steroidal framework with annotations for methyl groups and carbonyl functionalities.*
FDA Label Image

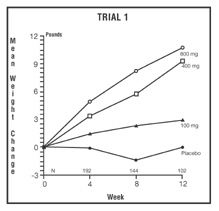
Trial1 Image (Megacees Trial1)

Trial1 Image (Megacees Trial1)
Line graph depicting mean weight change (in pounds) over 12 weeks in Trial 1. The graph compares weight change among groups receiving 800 mg, 400 mg, 100 mg doses, and a placebo, showing progressive weight increases for higher doses over time.*
FDA Label Image

Trial2 Image (Megacees Trial2)

Trial2 Image (Megacees Trial2)
A line graph depicting mean weight change over 12 weeks in Trial 2 comparing Megace ES 800 mg and placebo. The y-axis shows weight change in pounds, and the x-axis shows time in weeks. The graph shows increasing weight gain for 800 mg and stable or slight weight loss for placebo over the trial period.*

* About these descriptions: Image descriptions on this page are generated by automated AI analysis of the product label images from the manufacturer's FDA label submission (SPL). They are provided for reference only and may contain errors or omissions. Always rely on the printed label itself and the official FDA labeling, and consult a pharmacist or healthcare professional with any questions about this product.