Nucynta
Product Images NDC 16590-289

View Photos of Packaging, Regulatory Labels, and Product Appearance

Product Visual Gallery

This gallery contains 5 technical images submitted to the FDA as part of the official labeling for Nucynta (NDC 16590-289). Unlike standard consumer photos, these assets often include clinical data figures, molecular chemical structures, and official manufacturer packaging layouts.

As provided by Stat Rx Usa, these visuals offer a comprehensive scientific overview of the product's physical and chemical identity, aiding pharmacists and researchers in product verification and study.

FDA Label Image

Label Image (Nucynta 100 mg Label)
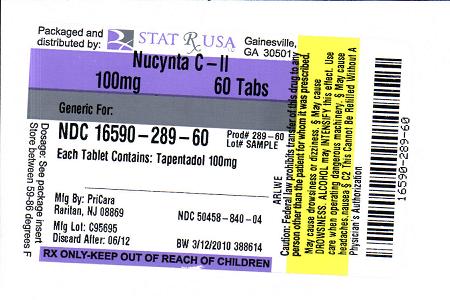
Label Image (Nucynta 100 mg Label)
Label for NUCYNTA C-II tablets, 100 mg strength, containing 60 tablets per container. The active ingredient is Tapentadol at 100 mg per tablet. The label indicates it is packaged and distributed by Stat Rx USA in Gainesville, GA. Manufacturer details include PriCara in Raritan, NJ, with an NDC of 16590-289-60. The label also includes a warning in a yellow panel and storage instructions.*
FDA Label Image

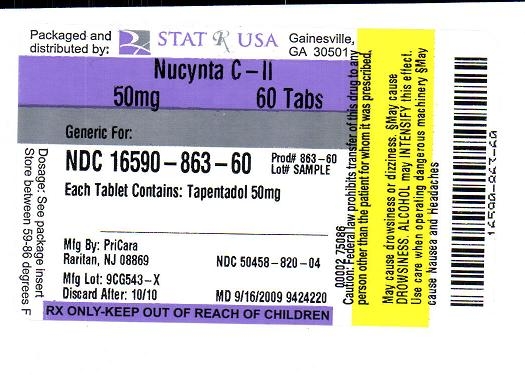
Label Image (Nucynta 50mg Label)

Label Image (Nucynta 50mg Label)
Label for NUCYNTA C-II 50 mg tablets, 60 count, generic for tapentadol 50 mg. Packaged and distributed by Stat Rx USA in Gainesville, GA. Manufactured by PriCara, Raritan, NJ. Includes caution notices about prescription status, dizziness, and handling warnings, with storage instructions and barcode.*
FDA Label Image

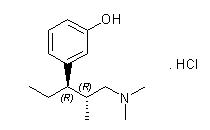
Chemical Structure (Nucynta 01)

Chemical Structure (Nucynta 01)
Chemical structure of NUCYNTA active ingredient showing the molecular arrangement including a phenol group, a tertiary amine, and a hydrochloride salt component.*
FDA Label Image

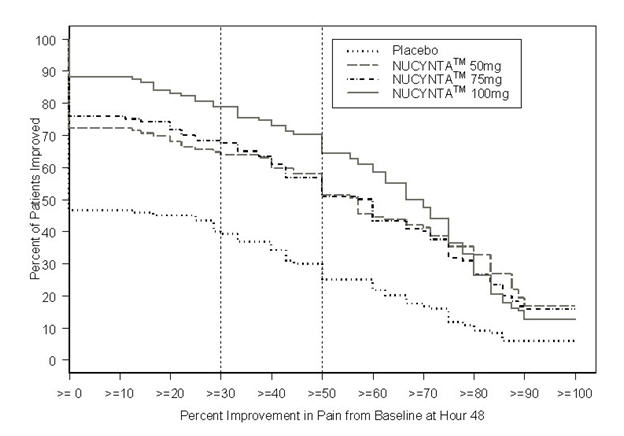
Figure (Nucynta 02)

Figure (Nucynta 02)
A line graph depicting percent improvement in pain from baseline at hour 48 on the x-axis and percent of patients improved on the y-axis. The chart compares placebo with NUCYNTA at 50 mg, 75 mg, and 100 mg dosages, showing distinct curves for each treatment option.*
FDA Label Image

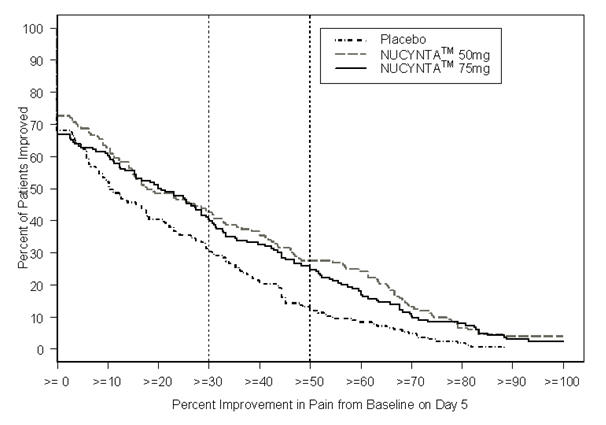
Figure (Nucynta 03)

Figure (Nucynta 03)
A line graph depicting the percent of patients improved versus percent improvement in pain from baseline on Day 5. It compares three groups: placebo, NUCYNTA 50 mg, and NUCYNTA 75 mg, showing trends of patient pain improvement across different improvement percentages.*

* About these descriptions: Image descriptions on this page are generated by automated AI analysis of the product label images from the manufacturer's FDA label submission (SPL). They are provided for reference only and may contain errors or omissions. Always rely on the printed label itself and the official FDA labeling, and consult a pharmacist or healthcare professional with any questions about this product.