Product Images Tamsulosin Hydrochloride

View Photos of Packaging, Labels & Appearance

Product Label Images

The following 7 images provide visual information about the product associated with Tamsulosin Hydrochloride NDC 16590-298 by Stat Rx Usa Llc, such as packaging, labeling, and the appearance of the drug itself. This resource could be helpful for medical professionals, pharmacists, and patients seeking to verify medication information and ensure they have the correct product.

Label Image - TAMSULOSIN HCL LABEL 298

Label Image - TAMSULOSIN HCL LABEL 298

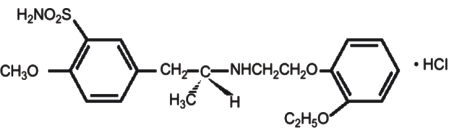
Packaged medication called Tamsulosin, distributed by Wockhardt USA LLC. Each capsule contains 0.4mg of Tamsulosin and is labeled with the NDC code 16590-298-30 and NOC code 64679-516-02. The medication is prescribed to treat urinary problems related to an enlarged prostate gland. The address of the distributor is not available.*

FIGURE1 - Tamsulosin HCl Capsules FIGURE 1

FIGURE1 - Tamsulosin HCl Capsules FIGURE 1

Figure 2A - Tamsulosin HCl Capsules Figure 2A

Figure 2A - Tamsulosin HCl Capsules Figure 2A

This appears to be a graph or table displaying the mean change in some variable based on different treatments and duration of treatment. However, without additional context it is difficult to accurately describe the study or outcome being presented.*

Figure 2B - Tamsulosin HCl Capsules Figure 2B

Figure 2B - Tamsulosin HCl Capsules Figure 2B

Figure3A - Tamsulosin HCl Capsules Figure 3A

Figure3A - Tamsulosin HCl Capsules Figure 3A

This is a graph showing the results of a treatment for a condition, with two groups: one receiving a medication and the other receiving a placebo. The vertical axis shows the quantity of a certain measurement (in mL/sec). The horizontal axis shows the number of weeks of treatment. The results show that the group receiving the medication had an improvement in the measurement compared to the placebo group, with a greater difference as the duration of treatment increased. There were different amounts of people in each group at the different time points (shown in parentheses next to the x-axis values).*

Figure3B - Tamsulosin HCl Capsules Figure 3B

Figure3B - Tamsulosin HCl Capsules Figure 3B

Structure - Tamsulosin HCl Capsules Structure

Structure - Tamsulosin HCl Capsules Structure

* The product label images have been analyzed using a combination of traditional computing and machine learning techniques. It should be noted that the descriptions provided may not be entirely accurate as they are experimental in nature. Use the information in this page at your own discretion and risk.