Fulvestrant Injection, Solution
Product Images NDC 16714-070

17 FDA label images from Northstar Rx, Llc, · Packaging, Regulatory Labels, and Product Appearance

Product Visual Gallery

This gallery contains 17 technical images submitted to the FDA as part of the official labeling for Fulvestrant (NDC 16714-070). Unlike standard consumer photos, these assets often include clinical data figures, molecular chemical structures, and official manufacturer packaging layouts.

As provided by Northstar Rx, Llc,, these visuals offer a comprehensive scientific overview of the product's physical and chemical identity, aiding pharmacists and researchers in product verification and study.

FDA Label Image

Carton-label.jpg (Carton Label)
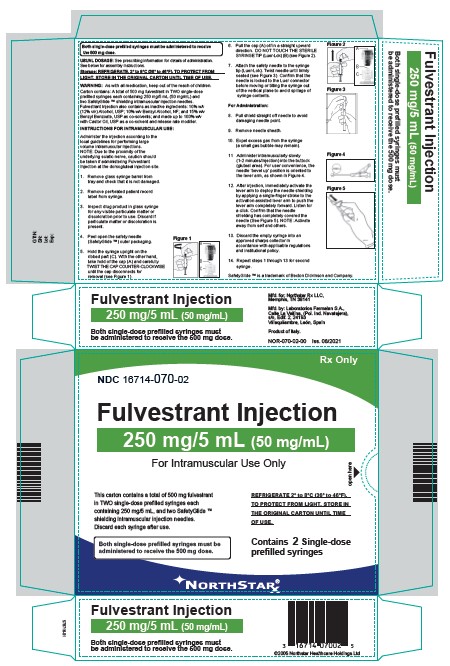
Carton-label.jpg (Carton Label)
FULVESTRANT Injection 250 mg/5 mL (50 mg/mL) solution for intramuscular use. The label indicates the product comes in a carton containing two single-dose prefilled syringes, providing a total of 500 mg fulvestrant. It includes administration instructions with figures and cautions to protect from light and store refrigerated. The labeler is Northstar Rx, LLC.*
FDA Label Image

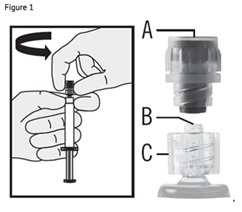
Figure-1 (Fulvestrant Inj Fig 1)

Figure-1 (Fulvestrant Inj Fig 1)
An instructional diagram showing how to remove the cap from an injection device. The left side depicts a hand twisting the syringe cap counterclockwise to detach it. The right side labels three parts of the cap: A is the top section, B the middle segment, and C the base that covers the needle hub.*
FDA Label Image

Figure-10 (Fulvestrant Inj Fig 10)

Figure-10 (Fulvestrant Inj Fig 10)
A Kaplan-Meier curve graph depicting overall survival probability (%) over time (months) for patients treated with fulvestrant plus palbociclib versus fulvestrant plus placebo. The graph includes the number of patients at risk at specific time points for each treatment group.*
FDA Label Image

Figure-11 (Fulvestrant Inj Fig 11)

Figure-11 (Fulvestrant Inj Fig 11)
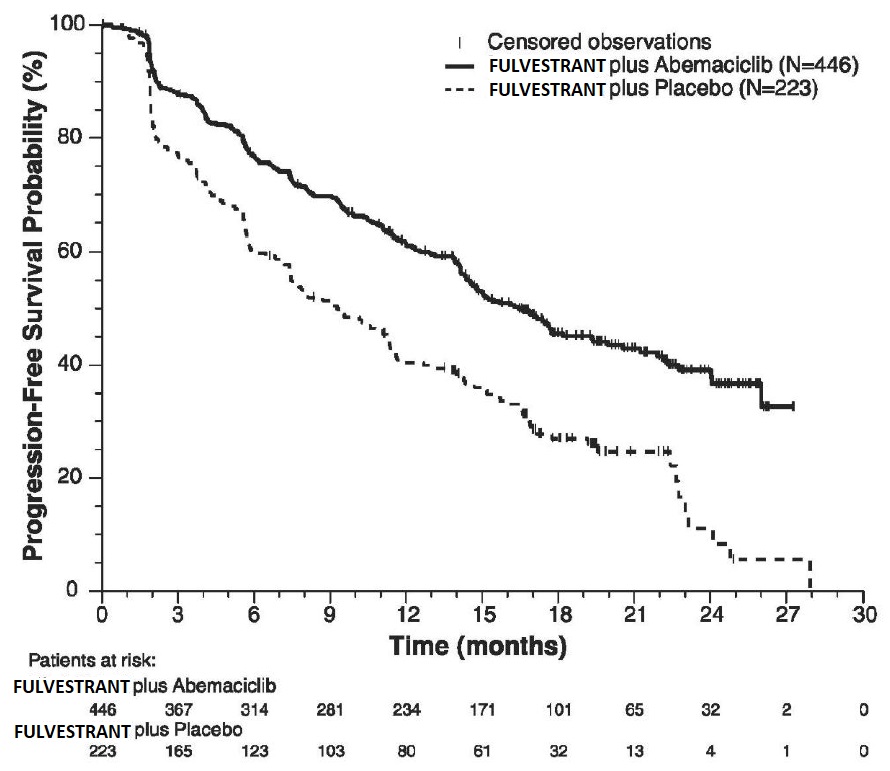
A Kaplan-Meier survival curve graph displaying progression-free survival probability (%) over time (months) for two treatment groups: FULVESTRANT plus Abemaciclib and FULVESTRANT plus Placebo. The solid line represents the Abemaciclib group, and the dashed line represents the Placebo group, with censored observations noted. Patient numbers at risk are listed below the time axis for each group at various months up to 27.*
FDA Label Image

Figure-12 (Fulvestrant Inj Fig 12)

Figure-12 (Fulvestrant Inj Fig 12)
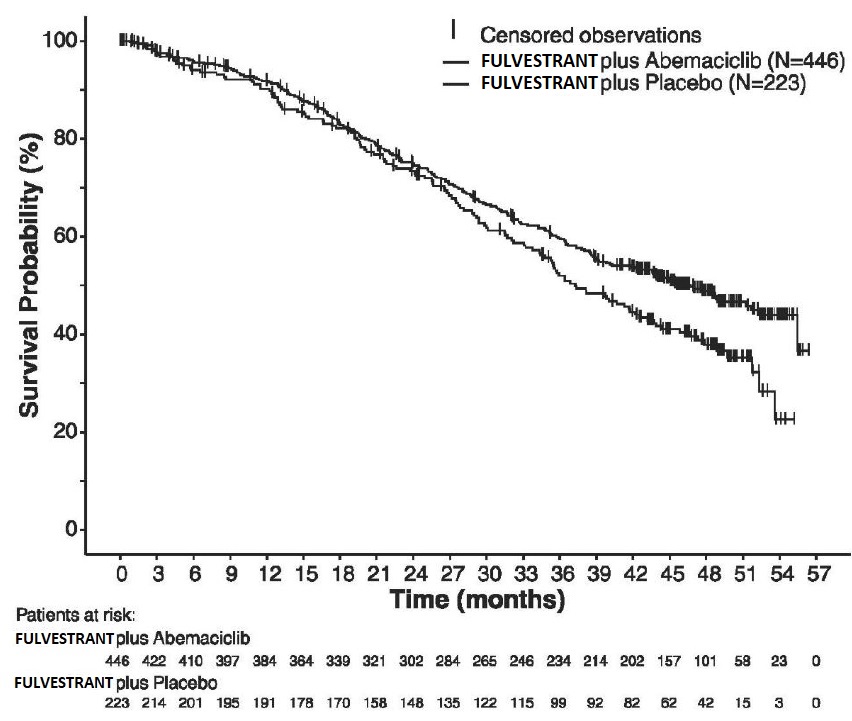
A Kaplan-Meier survival curve chart comparing survival probability (%) over time (months) between two groups: FULVESTRANT plus Abemaciclib (N=446) and FULVESTRANT plus Placebo (N=223). The chart includes censored observations and the number of patients at risk at various time points for both groups.*
FDA Label Image

Figure-13 (Fulvestrant Inj Fig 13)

Figure-13 (Fulvestrant Inj Fig 13)
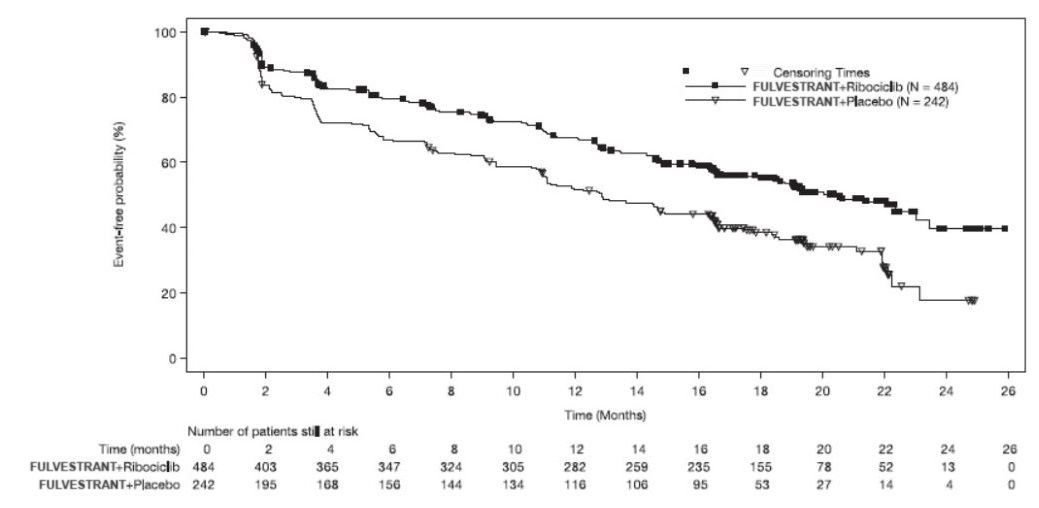
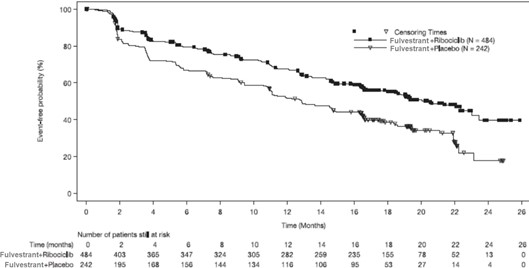
A Kaplan-Meier survival curve graph comparing event-free probability (%) over time in months for FULVESTRANT injection combined with Ribociclib versus FULVESTRANT with placebo. The x-axis shows time (0 to 26 months), and the y-axis shows event-free probability (0 to 100%). Two survival curves are plotted, including censoring time points, with a table below indicating the number of patients at risk at each time interval.*
FDA Label Image

Figure-14 (Fulvestrant Inj Fig 14)

Figure-14 (Fulvestrant Inj Fig 14)
A Kaplan-Meier survival curve chart displaying event-free probability over time (months) for two groups: Fulvestrant + Ribociclib (N=484) and Fulvestrant + Placebo (N=242). The chart includes censoring times indicated by markers and a table below showing the number of patients at risk at various time points up to 26 months.*
FDA Label Image

Figure-2 (Fulvestrant Inj Fig 2)

Figure-2 (Fulvestrant Inj Fig 2)
An instructional illustration showing how to connect or assemble parts of a medical syringe or injection device. The image depicts a hand holding a syringe and lifting or attaching a small component labeled 'A', with two other labeled components 'B' and 'C' shown below it.*
FDA Label Image

Figure-3 (Fulvestrant Inj Fig 3)

Figure-3 (Fulvestrant Inj Fig 3)
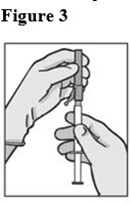
An instructional diagram labeled 'Figure 3' showing two hands preparing a syringe. The image illustrates the action of holding and manipulating a syringe, likely demonstrating proper injection technique or preparation steps.*
FDA Label Image

Figure-4 (Fulvestrant Inj Fig 4)

Figure-4 (Fulvestrant Inj Fig 4)
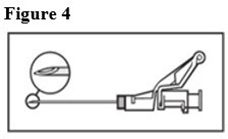
An instructional diagram showing the proper technique for using an injection, focusing on correct needle insertion angle and positioning for intramuscular administration.*
FDA Label Image

Figure-5 (Fulvestrant Inj Fig 5)

Figure-5 (Fulvestrant Inj Fig 5)
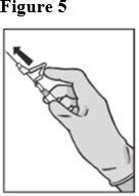
An instructional illustration showing a hand holding a syringe with the needle pointing upward, and an arrow indicating the direction to pull or draw, likely demonstrating preparation steps for an injection.*
FDA Label Image

Figure-6 (Fulvestrant Inj Fig 6)

Figure-6 (Fulvestrant Inj Fig 6)
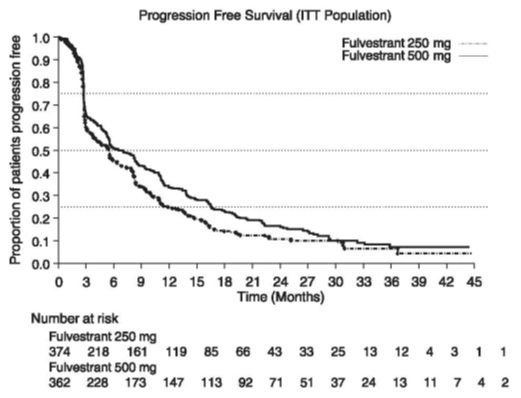
A line graph titled 'Progression Free Survival (ITT Population)' showing the proportion of patients progression free over time in months. The graph compares two doses of fulvestrant, 250 mg and 500 mg, with corresponding survival curves and a table of patient numbers at risk for each dose across the time points.*
FDA Label Image

Figure-7 (Fulvestrant Inj Fig 7)

Figure-7 (Fulvestrant Inj Fig 7)
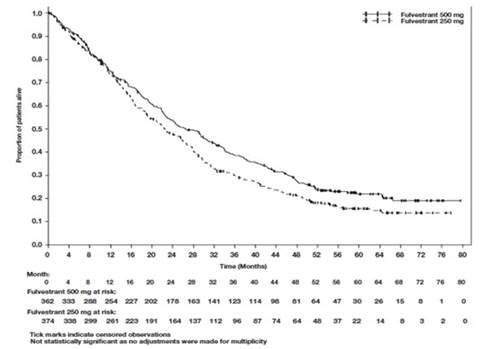
A line graph showing the proportion of patients over time (in months) for fulvestrant dosages of 500 mg and 250 mg. The x-axis represents time up to 80 months, and the y-axis shows the proportion of patients. Two lines indicate patient survival or persistence rates for each dosage, with numerical data of patients at risk listed below the x-axis.*
FDA Label Image

Figure-8 (Fulvestrant Inj Fig 8)

Figure-8 (Fulvestrant Inj Fig 8)
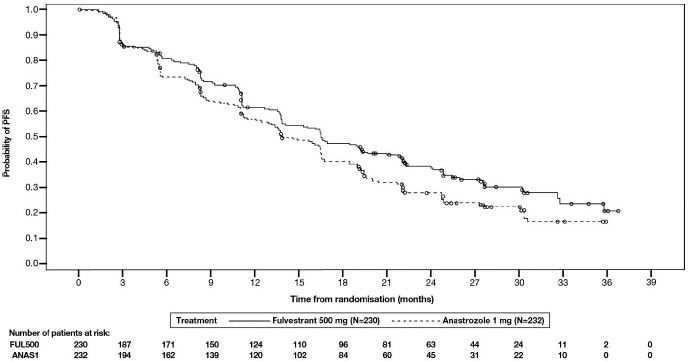
A Kaplan-Meier survival curve chart displaying the probability of progression-free survival (PFS) over time in months from randomization. The chart compares two treatments, fulvestrant 500 mg and anastrozole 1 mg. Below the graph is a table showing the number of patients at risk at different time points for each treatment group.*
FDA Label Image

Figure-9 (Fulvestrant Inj Fig 9)

Figure-9 (Fulvestrant Inj Fig 9)
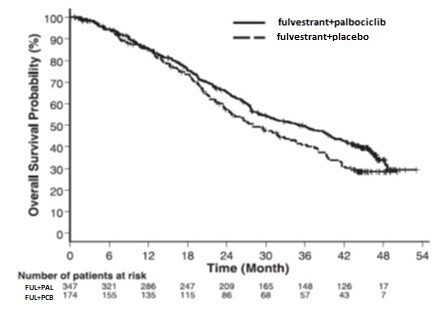
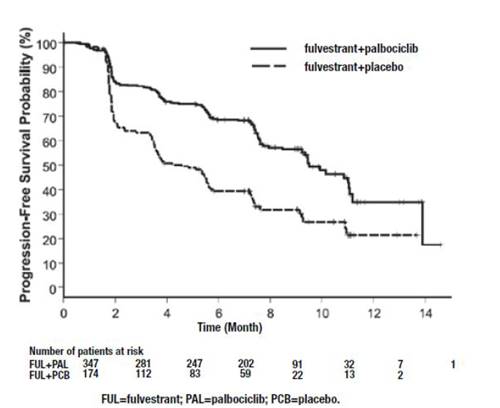
A Kaplan-Meier survival curve chart displaying progression-free survival probability (%) over time in months for patients treated with fulvestrant plus palbociclib versus fulvestrant plus placebo. The chart shows two curves: a solid line for fulvestrant plus palbociclib and a dashed line for fulvestrant plus placebo. Patient numbers at risk are indicated at various time points below the x-axis.*
FDA Label Image

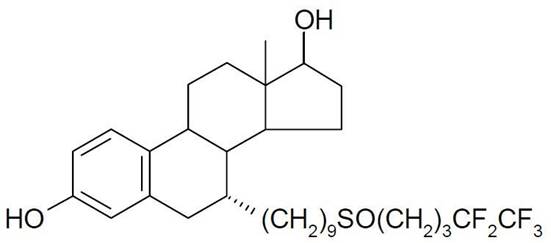
Structure (Fulvestrant Inj Structure)

Structure (Fulvestrant Inj Structure)
Chemical structure of fulvestrant, showing its molecular framework with hydroxyl groups, alkyl chains, and trifluoromethyl substituents as part of its steroid backbone.*
FDA Label Image

Container-label.jpg (Vial Label)

Container-label.jpg (Vial Label)
Label for Fulvestrant Injection 250 mg/5 mL (50 mg/mL) for intramuscular use, marketed by Northstar Rx, LLC. The label includes directions to protect from light and specifies administration of both single-dose prefilled syringes to achieve a 500 mg dose. It also provides manufacturing details and spaces for lot number, expiration date, and administration record.*

* About these descriptions: Image descriptions on this page are generated by automated AI analysis of the product label images from the manufacturer's FDA label submission (SPL). They are provided for reference only and may contain errors or omissions. Always rely on the printed label itself and the official FDA labeling, and consult a pharmacist or healthcare professional with any questions about this product.