Figure1 (Figure1)
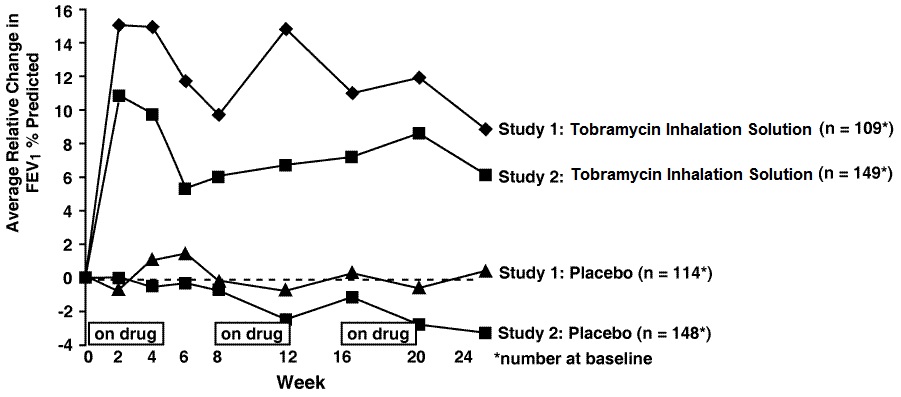
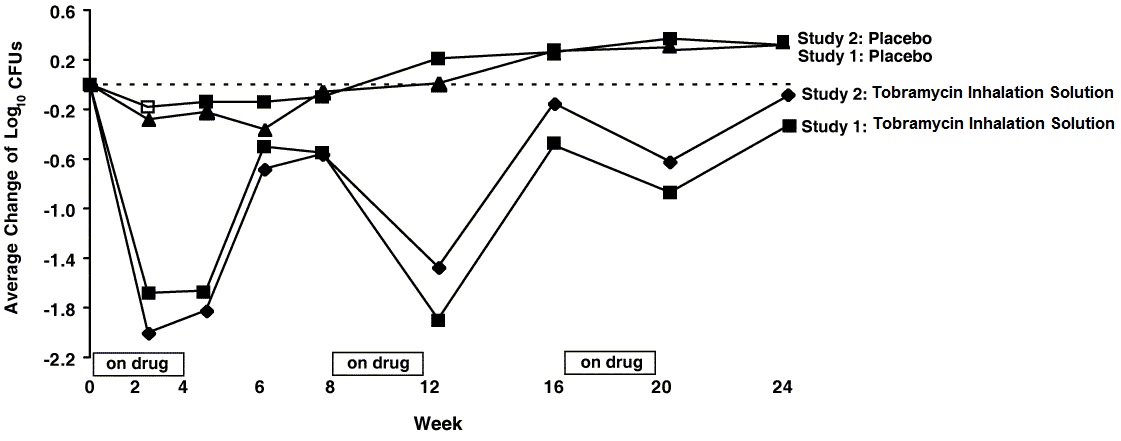
This graph shows the average relative change in FEV1% predicted for two different studies involving tobramycin inhalation solution and a placebo. The first study had 109 participants on the drug and 114 on the placebo, and the second study had 149 on the drug and 148 on the placebo. The graph is plotted over a period of 24 weeks, with the number of participants at baseline indicated by the asterisk.*