Product Images Azacitidine

View Photos of Packaging, Labels & Appearance

Product Label Images

The following 4 images provide visual information about the product associated with Azacitidine NDC 16714-927 by Northstar Rxllc, such as packaging, labeling, and the appearance of the drug itself. This resource could be helpful for medical professionals, pharmacists, and patients seeking to verify medication information and ensure they have the correct product.

Carton - Carton

Carton - Carton

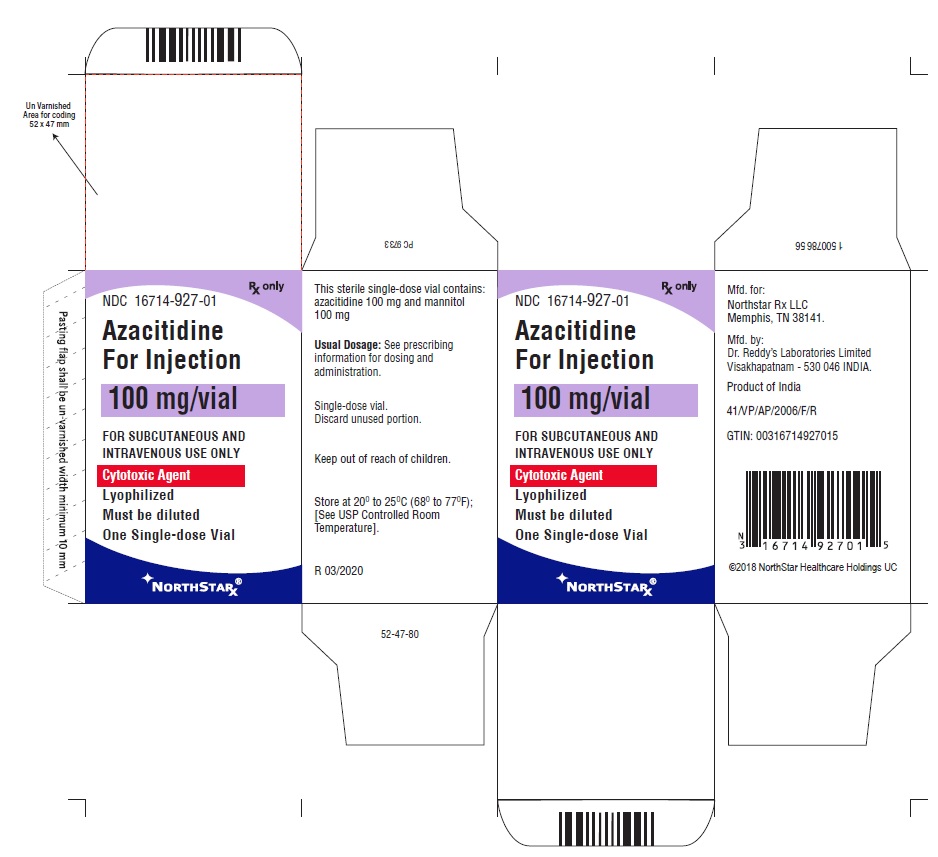
Azacitidine is a medication for injection indicated for subcutaneous and intravenous use. The medication is found in a sterile single-dose vial containing 100mg/vial of azacitidine and mannitol. Azacitidine should be diluted before use and the dosage should be determined according to the prescribing information. The unused portion should be discarded and kept out of reach of children. The medication should be stored within the range of 20°C to 25°C (68°F to 77°F).*

Vial - Vial

Vial - Vial

This is a description of a single-dose vial of Azacitidine for Injection. It comes in a 100mg/vial strength and must be diluted. The vial contains azacitidine 100mg and mannitol 100mg. The usual dosage is advised to be determined from the prescribing information for dosing and administration. It's meant for subcutaneous and intravenous use only, and unused portions should be discarded. The vial must be stored between 20°C to 25°C (68°F to 77°F). The manufacturing company is Northstar Rx LLC in Memphis, TN, and it was made by Dr. Reddy's Laboratories Limited in Visakhapatnam, India.*

graph - graph

graph - graph

This is a statistical analysis of a medical study with two groups of patients treated with different therapies. The Log-Rank test yielded a p-value of 0.0001, indicating a significant difference in survival between the two groups. The Hazard Ratio (HR) for the treatment being evaluated is 0.58 with a 95% confidence interval of 0.43 to 0.77. The number of deaths in each group is provided (82 in the Aza group and 113 in the CCR group), and a survival curve is presented graphically, showing the proportion of patients surviving over time for each group. The X-axis represents time in months, and the Y-axis represents the proportion of patients. The number of patients "at risk" at each time point is also provided for each group.*

structure - structure

structure - structure

* The product label images have been analyzed using a combination of traditional computing and machine learning techniques. It should be noted that the descriptions provided may not be entirely accurate as they are experimental in nature. Use the information in this page at your own discretion and risk.