Pemetrexed Injection, Powder, Lyophilized, For Solution
Product Images NDC 16729-229

View Photos of Packaging, Regulatory Labels, and Product Appearance

Product Visual Gallery

This gallery contains 16 technical images submitted to the FDA as part of the official labeling for Pemetrexed (NDC 16729-229). Unlike standard consumer photos, these assets often include clinical data figures, molecular chemical structures, and official manufacturer packaging layouts.

As provided by Accord Healthcare Inc., these visuals offer a comprehensive scientific overview of the product's physical and chemical identity, aiding pharmacists and researchers in product verification and study.

FDA Label Image

Pemetrexed For Injection 100 mg/vial (Carton)

Pemetrexed For Injection 100 mg/vial (Carton)
Label for Pemetrexed injection 100 mg/vial, powder lyophilized for solution, by Accord Healthcare Inc. It is a single-dose vial for intravenous use only, marked Rx Only. The label includes caution about the product being a cytotoxic agent, NDC 16729-229-03, and instructions for reconstitution and storage.*
FDA Label Image

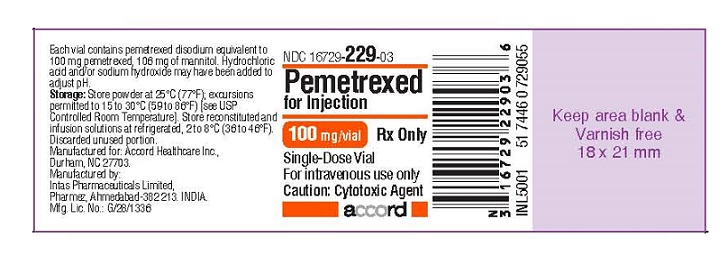
Pemetrexed For Injection 100 mg/vial (Vial label)

Pemetrexed For Injection 100 mg/vial (Vial label)
PEMETREXED 100 mg/vial injection label for lyophilized powder for intravenous use. The label includes dosage strength, handling instructions, and cautions, specifying it as a single-dose vial. It shows storage conditions and manufacturer information, Accord Healthcare Inc., with barcode and NDC 16729-229-03.*
FDA Label Image

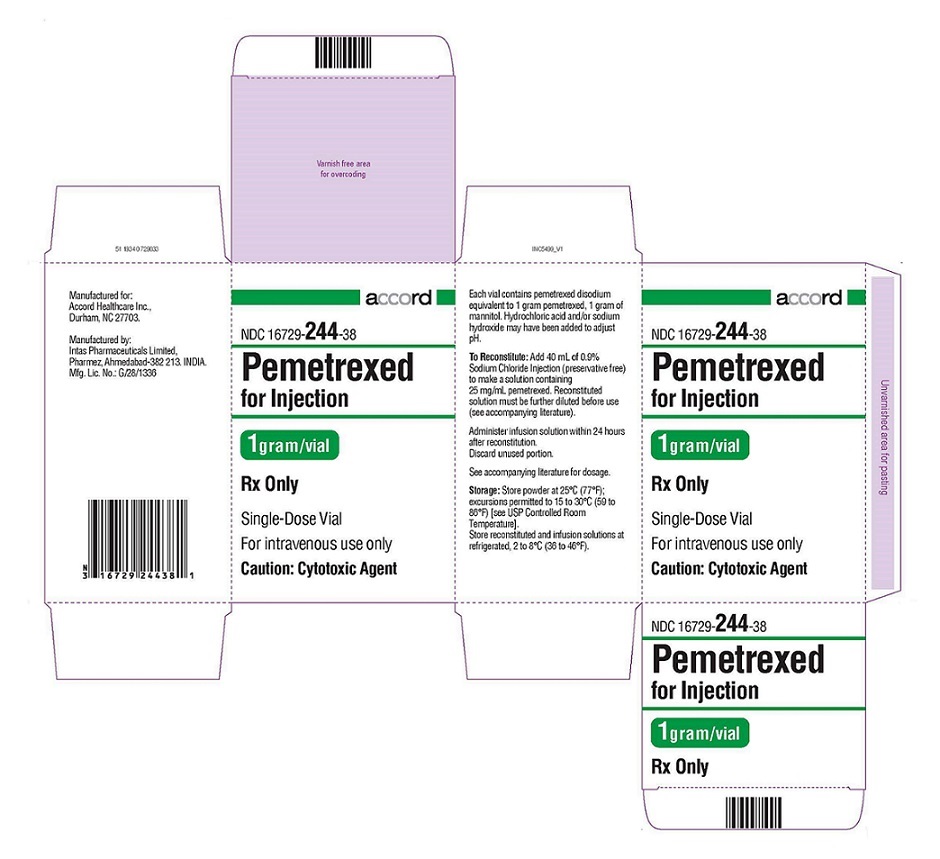
Pemetrexed For Injection 1 Gram/vial (Carton)

Pemetrexed For Injection 1 Gram/vial (Carton)
Packaging label for Pemetrexed for Injection 1 gram/vial by Accord Healthcare Inc. The label indicates a single-dose vial for intravenous use only, marked as Rx only and cautioned as a cytotoxic agent. Reconstitution and storage instructions are provided, along with the NDC number 16729-244-38. The label includes manufacturer information and barcodes.*
FDA Label Image

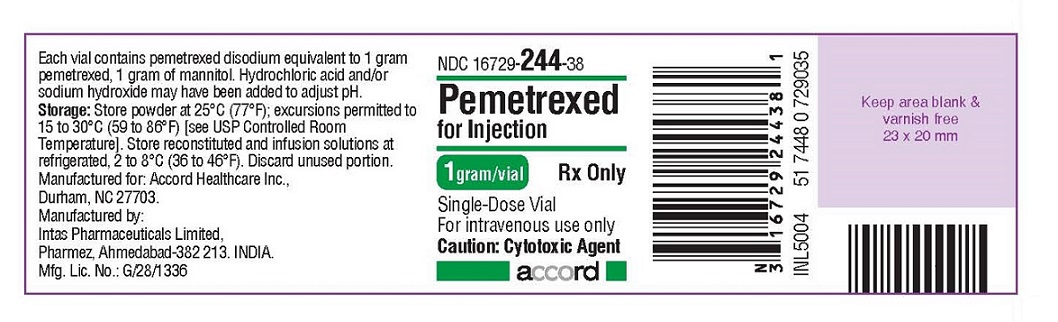
Pemetrexed For Injection 1 Gram/vial (Vial label)

Pemetrexed For Injection 1 Gram/vial (Vial label)
Pemetrexed for Injection 1 gram/vial lyophilized powder label. It is for intravenous use only and supplied as a single-dose vial. The label includes storage instructions, manufacturer information (Accord Healthcare Inc. and Intas Pharmaceuticals Limited, India), and a caution that it is a cytotoxic agent. The label features NDC 16729-244 and barcodes.*
FDA Label Image

Pemetrexed For Injection 500 mg/vial (Carton)

Pemetrexed For Injection 500 mg/vial (Carton)
Box packaging label for Pemetrexed Injection 500 mg/vial by Accord Healthcare Inc. The label states the drug is for intravenous use only, single-dose vial, and is a cytotoxic agent. It includes storage and reconstitution instructions, lot and expiration barcode areas, and manufacturer information from Intas Pharmaceuticals Limited, India.*
FDA Label Image

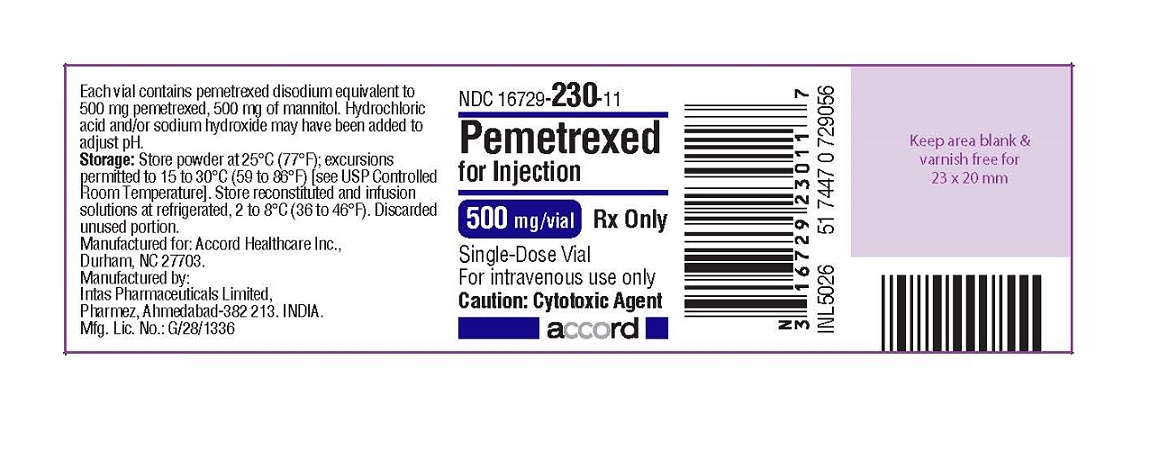
Pemetrexed For Injection 500 mg/vial -vial Label (Pemetrexed 500mg Label)

Pemetrexed For Injection 500 mg/vial -vial Label (Pemetrexed 500mg Label)
Label for Pemetrexed injection, powder, lyophilized for solution, 500 mg per vial by Accord Healthcare Inc. The label states it is a single-dose vial for intravenous use only and notes the product as a cytotoxic agent. Storage and manufacturer details are also included along with NDC 16729-230-11 and barcode.*
FDA Label Image

Figure 1 (Pemetrexed Figure 1)

Figure 1 (Pemetrexed Figure 1)
A Kaplan-Meier survival curve chart depicting overall survival percentage over time in months for two treatment arms labeled P+P+C and P+C. The chart includes a legend for the treatment arms and a table below showing the number at risk at various time points for each arm.*
FDA Label Image

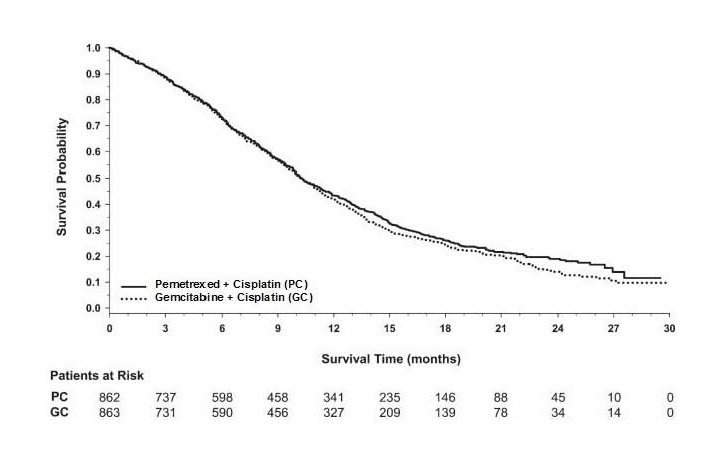
Figure 2 (Pemetrexed Figure 2)

Figure 2 (Pemetrexed Figure 2)
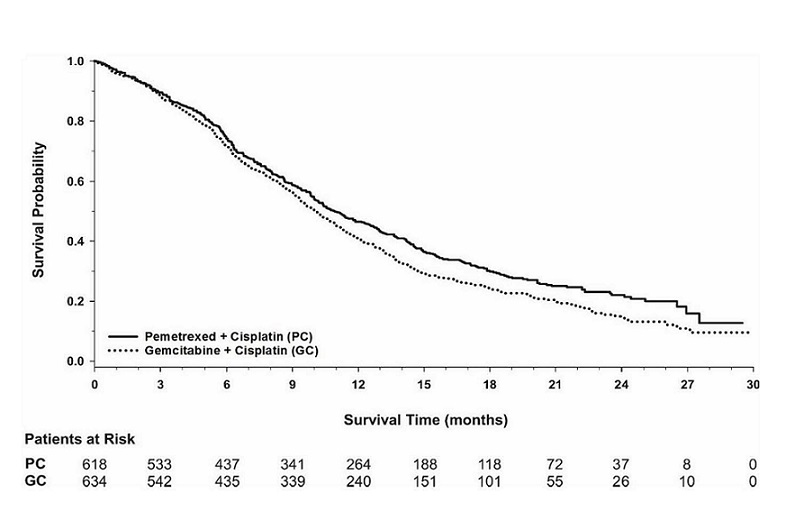
A survival probability chart comparing two treatment groups over time in months: Pemetrexed plus Cisplatin (PC) and Gemcitabine plus Cisplatin (GC). The y-axis shows survival probability from 0 to 1, and the x-axis shows survival time up to 30 months. A table below lists the number of patients at risk at different time points for each group.*
FDA Label Image

Figure 3 (Pemetrexed Figure 3)

Figure 3 (Pemetrexed Figure 3)
A survival probability curve comparing two treatment groups over 30 months: Pemetrexed + Cisplatin (solid line) and Gemcitabine + Cisplatin (dotted line). The y-axis shows survival probability from 0.0 to 1.0, and the x-axis shows survival time in months from 0 to 30. Below the graph, the number of patients at risk is listed at various time points for both groups (PC and GC).*
FDA Label Image

Figure 4 (Pemetrexed Figure 4)

Figure 4 (Pemetrexed Figure 4)
A survival probability curve graph comparing two chemotherapy regimens over time in months. The solid line represents Pemetrexed plus Cisplatin (PC), and the dotted line represents Gemcitabine plus Cisplatin (GC). The y-axis shows survival probability from 0.0 to 1.0, and the x-axis shows survival time up to 30 months, with patient counts at risk displayed below the x-axis for each regimen at multiple time points.*
FDA Label Image

Figure 5 (Pemetrexed Figure 5)

Figure 5 (Pemetrexed Figure 5)
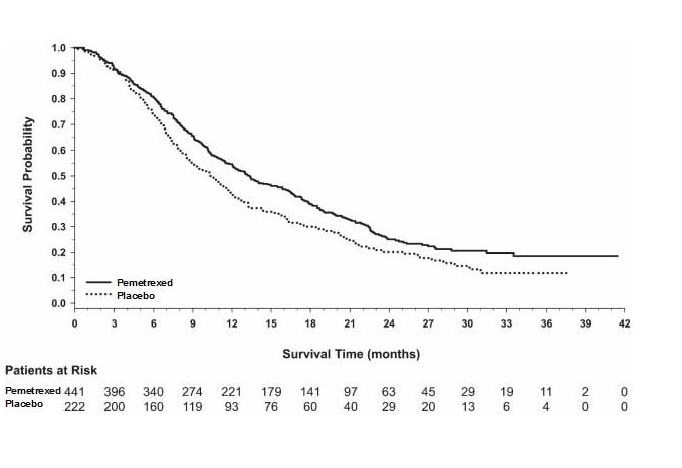
A survival curve chart comparing survival probability over time (in months) between Pemetrexed and Placebo groups. The solid line represents Pemetrexed, and the dotted line represents Placebo. The chart includes a risk table showing the number of patients at risk for each group at various time points from 0 to 42 months.*
FDA Label Image

Figure 6 (Pemetrexed Figure 6)

Figure 6 (Pemetrexed Figure 6)
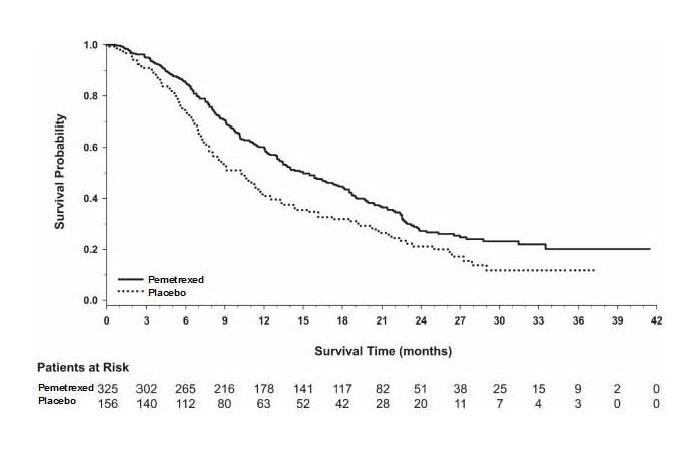
A survival probability curve comparing Pemetrexed injection to placebo over survival time in months. The solid line represents Pemetrexed, and the dotted line represents placebo. The chart shows higher survival probability for Pemetrexed across time. Numbers of patients at risk are listed below the x-axis for both groups at various time points up to 42 months.*
FDA Label Image

Figure 7 (Pemetrexed Figure 7)

Figure 7 (Pemetrexed Figure 7)
A Kaplan-Meier survival curve comparing survival probability over time (months) for Pemetrexed versus placebo. The graph plots survival probability on the y-axis and survival time in months on the x-axis. Below is a table showing patients at risk at various time points for both treatment groups.*
FDA Label Image

Figure 8 (Pemetrexed Figure 8)

Figure 8 (Pemetrexed Figure 8)
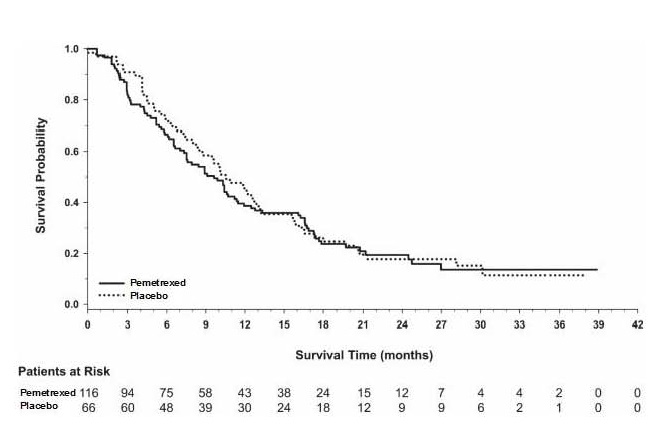
A Kaplan-Meier survival curve comparing survival probability over time (months) between patients treated with Pemetrexed and a placebo. The graph includes a legend distinguishing Pemetrexed (solid line) and placebo (dotted line) groups, and a table showing the number of patients at risk at various time points up to 36 months.*
FDA Label Image

Figure 9 (Pemetrexed Figure 9)

Figure 9 (Pemetrexed Figure 9)
A survival curve chart comparing survival probability over time in months between two treatment groups: Pemetrexed plus Cisplatin (solid line) and Cisplatin alone (dotted line). The chart includes a table showing the number of patients at risk at various time points for each group.*
FDA Label Image

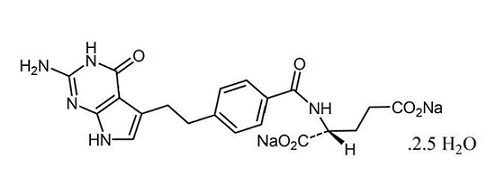
Structural Formula (Pemetrexed Structure)

Structural Formula (Pemetrexed Structure)
Chemical structure diagram of the active ingredient Pemetrexed, showing the detailed molecular composition including rings, functional groups, and sodium and water molecules as part of the structure.*

* About these descriptions: Image descriptions on this page are generated by automated AI analysis of the product label images from the manufacturer's FDA label submission (SPL). They are provided for reference only and may contain errors or omissions. Always rely on the printed label itself and the official FDA labeling, and consult a pharmacist or healthcare professional with any questions about this product.