Prasugrel Tablet, Film Coated
Product Images NDC 16729-273

View Photos of Packaging, Regulatory Labels, and Product Appearance

Product Visual Gallery

This gallery contains 9 technical images submitted to the FDA as part of the official labeling for Prasugrel (NDC 16729-273). Unlike standard consumer photos, these assets often include clinical data figures, molecular chemical structures, and official manufacturer packaging layouts.

As provided by Accord Healthcare Inc., these visuals offer a comprehensive scientific overview of the product's physical and chemical identity, aiding pharmacists and researchers in product verification and study.

FDA Label Image

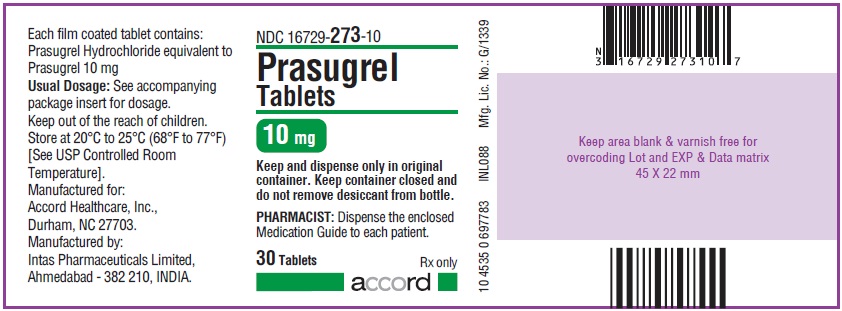
Prasugrel Tablets 10 mg 30 Tablets (Container Label)
Prasugrel Tablets 10 mg 30 Tablets (Container Label)
Prasugrel Tablets label showing 10 mg film-coated tablets. The label includes storage instructions, manufacturer and labeler information (Accord Healthcare Inc.), and the container holds 30 tablets. The National Drug Code (NDC) is 16729-273-10. The label advises to keep tablets in the original container and includes pharmacy dispensing instructions.*
FDA Label Image

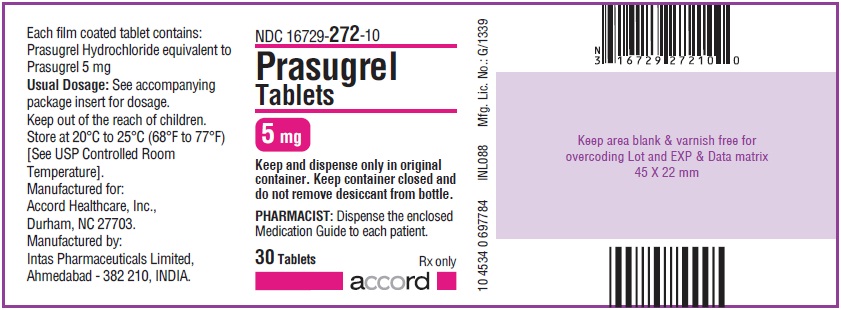
Prasugrel Tablets 5 mg 30 Tablets-container Label (Prasugrel 5mg 30 Label)

Prasugrel Tablets 5 mg 30 Tablets-container Label (Prasugrel 5mg 30 Label)
Prasugrel 5 mg film-coated tablets label showing dosage strength, quantity of 30 tablets, and storage instructions. Manufactured by Intas Pharmaceuticals Limited and labeled by Accord Healthcare Inc. The label includes warnings to keep tablets in their original container and to dispense the provided medication guide. NDC code 16729-272-10 is visible along with barcodes and manufacturer information.*
FDA Label Image

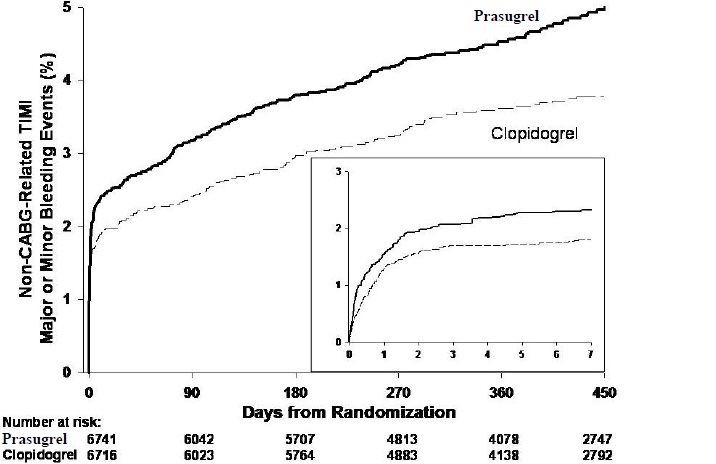
Figure 1 (Prasugrel Fig1)

Figure 1 (Prasugrel Fig1)
A Kaplan-Meier plot showing the percentage of Non-CABG-Related TIMI Major or Minor Bleeding Events over 450 days from randomization. Two lines compare Prasugrel and Clopidogrel treatments, with Prasugrel consistently showing a higher percentage of events. The graph includes a smaller inset plot depicting the same comparison over the first 7 days. Numbers at risk for each group are indicated below the x-axis at various time points.*
FDA Label Image

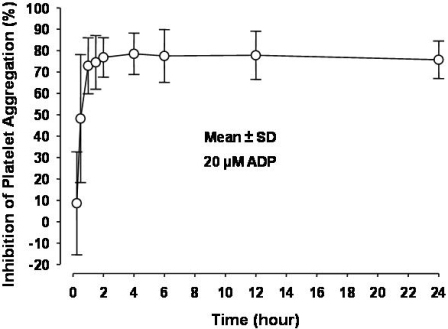
Figure 2 (Prasugrel Fig2)

Figure 2 (Prasugrel Fig2)
A line chart depicting the inhibition of platelet aggregation (%) over time (hours) following a 20 µM ADP stimulus. Data points show mean values with standard deviation error bars, illustrating how inhibition rises quickly within the first 2 hours and then plateaus through 24 hours.*
FDA Label Image

Figure 3 (Prasugrel Fig3)

Figure 3 (Prasugrel Fig3)
A line graph comparing cardiovascular outcomes over time in patients with UA/NSTEMI treated with prasugrel versus clopidogrel. The y-axis shows the percentage of cardiovascular death, nonfatal myocardial infarction, or nonfatal stroke, ranging from 0% to 13%. The x-axis shows days from randomization, spanning 0 to 450 days. The graph includes a significant p-value of 0.002, with prasugrel represented by a solid line and clopidogrel by a dashed line, showing lower event rates for prasugrel. An inset presents a similar comparison with a p-value of 0.017.*
FDA Label Image

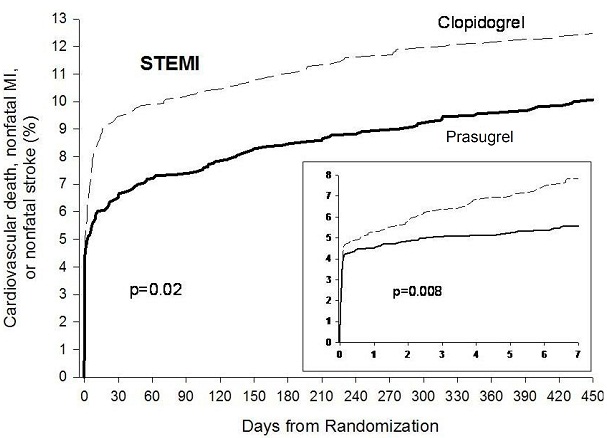
Figure 3 (Prasugrel Fig4)

Figure 3 (Prasugrel Fig4)
A line chart comparing cardiovascular death, nonfatal myocardial infarction, or nonfatal stroke (%) over days from randomization (0 to 450) between Clopidogrel and Prasugrel in STEMI patients. Clopidogrel is represented by a dashed line, and Prasugrel by a solid line, showing lower event percentages for Prasugrel. Two p-values, 0.02 and 0.008, are noted, with a zoomed inset focusing on the first 7 days.*
FDA Label Image

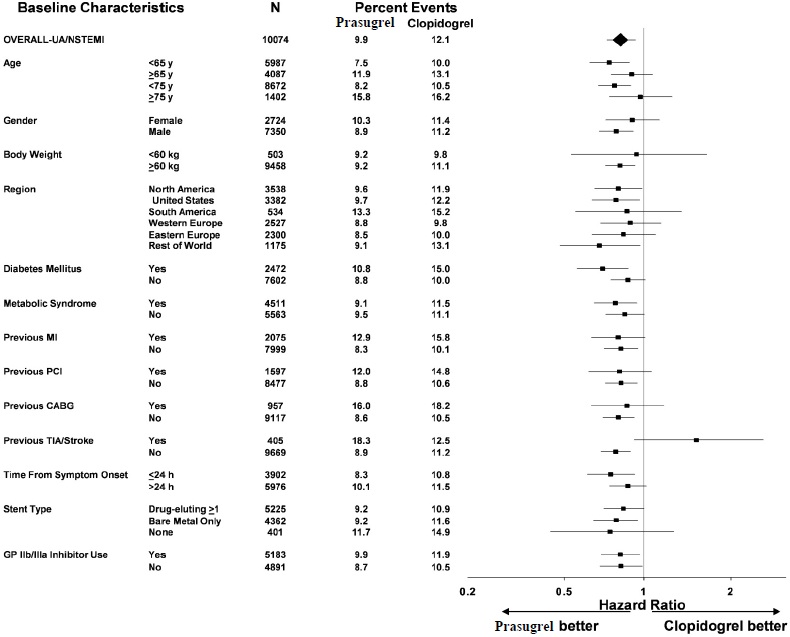
Figure 4 (Prasugrel Fig5)

Figure 4 (Prasugrel Fig5)
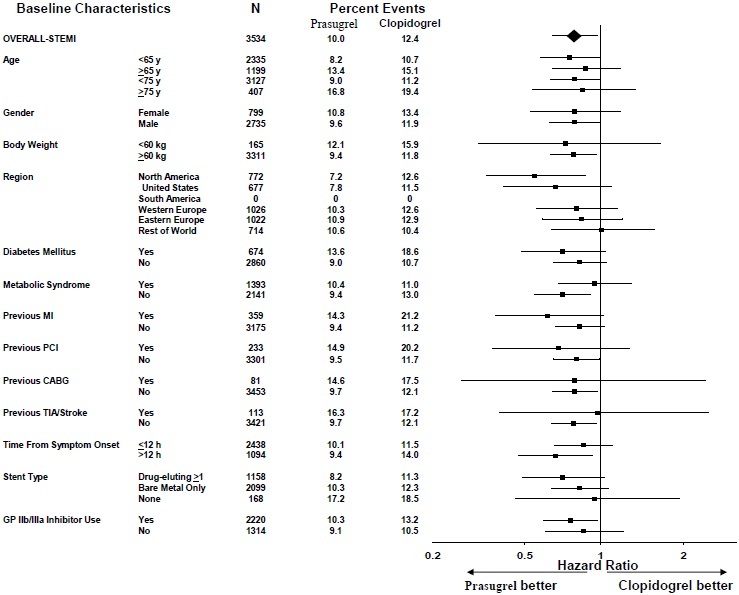
A forest plot chart comparing the percent events and hazard ratios for Prasugrel versus Clopidogrel across various baseline characteristics, including age groups, gender, body weight, geographic region, diabetes mellitus, metabolic syndrome, prior medical conditions, symptom onset timing, stent type, and GP IIb/IIIa inhibitor use. The plot visually represents treatment effect sizes with hazard ratios favoring either Prasugrel or Clopidogrel.*
FDA Label Image

Figure 5 (Prasugrel Fig6)

Figure 5 (Prasugrel Fig6)
A forest plot chart comparing hazard ratios for various baseline characteristic subgroups between Prasugrel 10 mg and Clopidogrel, showing percent events and confidence intervals for each subgroup. The x-axis represents hazard ratios with values favoring either Prasugrel or Clopidogrel.*
FDA Label Image

Structural Formula (Prasugrel Str)

Structural Formula (Prasugrel Str)
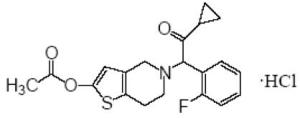
Chemical structure of prasugrel hydrochloride, a prescription drug active ingredient. The diagram shows molecular bonds and atoms including fluorine, sulfur, nitrogen, oxygen, and chlorine in the compound.*

* About these descriptions: Image descriptions on this page are generated by automated AI analysis of the product label images from the manufacturer's FDA label submission (SPL). They are provided for reference only and may contain errors or omissions. Always rely on the printed label itself and the official FDA labeling, and consult a pharmacist or healthcare professional with any questions about this product.