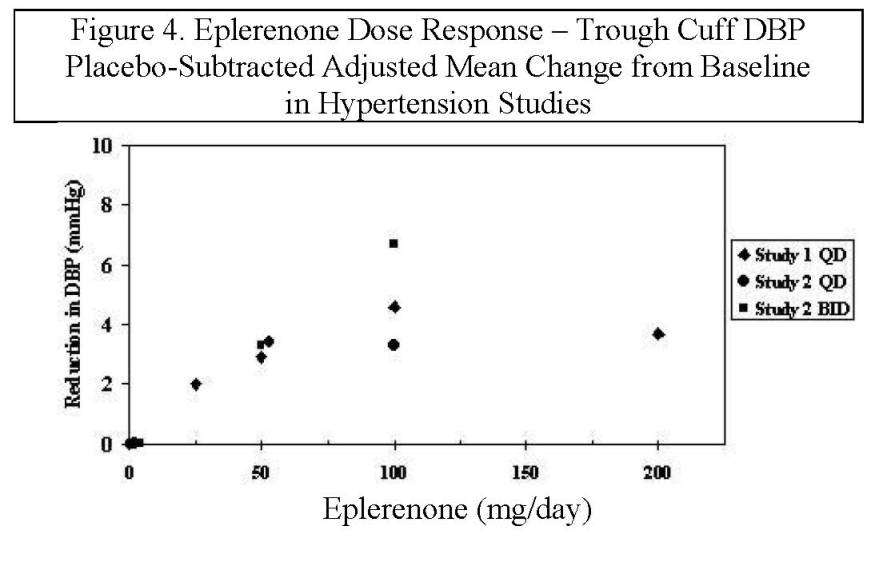
Figure (Eplerenone Fig 3)

This is a data figure showing the Eplerenone dose response in hypertension studies. The y-axis displays the placebo-subtracted adjusted mean change from baseline in trough cuff systolic blood pressure (SBP). The x-axis shows the Eplerenone dose in milligrams per day. There are three studies represented; Study 1 had a once-daily dose of 50mg, Study 2 had a once-daily dose of 100mg or twice-daily dose of 50mg, and Study 3 had a once-daily dose of 200mg.*