Pirfenidone Tablet, Film Coated
Product Images NDC 16729-467

View Photos of Packaging, Regulatory Labels, and Product Appearance

Product Visual Gallery

This gallery contains 6 technical images submitted to the FDA as part of the official labeling for Pirfenidone (NDC 16729-467). Unlike standard consumer photos, these assets often include clinical data figures, molecular chemical structures, and official manufacturer packaging layouts.

As provided by Accord Healthcare Inc., these visuals offer a comprehensive scientific overview of the product's physical and chemical identity, aiding pharmacists and researchers in product verification and study.

FDA Label Image

267 mg 90 Tablets (Pirfenidone 267mg 90tablets)

267 mg 90 Tablets (Pirfenidone 267mg 90tablets)
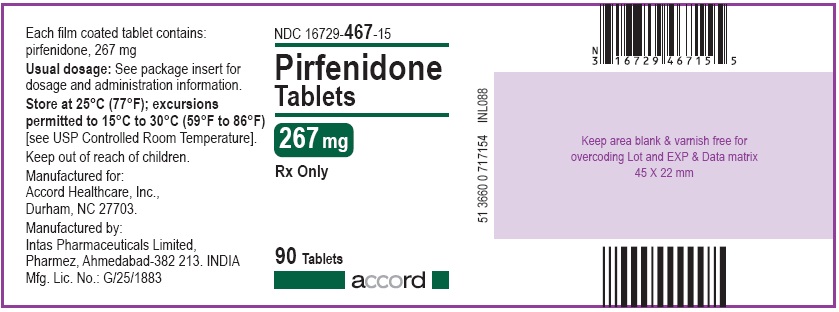
Each film-coated tablet has 267 mg of pirenidone. It is vital to check the package insert for dosage and administration information. The product should be stored between 15°C and 30°C (59°F to 86°F), excursions are permitted to 25°C (T7°F), as indicated by USP Controlled Room Temperature. The medication is produced by Intas Pharmaceuticals Limited in Ahmedabad, INDIA, and distributed by Accord Healthcare, Inc, in Durham, NC 27703. The product's name is Pirfenidone Tablets, and the package contains 90 tablets. For additional details, there is a symbol indicating that the area must be clear and free of any information for overcading Lot and EXP & Data Matrix.*
FDA Label Image

801 mg 90 Tablets (Pirfenidone 801mg 90tablets)

801 mg 90 Tablets (Pirfenidone 801mg 90tablets)
This text describes a medication called Pirfenidone in the form of film coated tablets, with each containing 801mg of the medication. The recommended dosage details are provided in the package insert. The tablets should be stored within a specific temperature range and kept out of reach of children. The medication is manufactured for Accord Healthcare in North Carolina and is produced by Intas Pharmaceuticals in India. The tablet's lot and expiration details are provided along with a unique identification number.*
FDA Label Image

Figure 1 (Pirfenidone Figure1)

Figure 1 (Pirfenidone Figure1)
This text appears to be a chart presenting data for patients taking Pirfenidone and Placebo, measuring Worsening (decrease in %FVC) and No Decline (increase in %FVC) over 52 weeks. The numbers in the chart correspond to the percentage of patients experiencing either worsening or no decline. The text also includes the absolute change in %FVC from baseline to week 52.*
FDA Label Image

Figure 2 (Pirfenidone Figure2)

Figure 2 (Pirfenidone Figure2)
This is a chart showing the Mean Change in Forced Vital Capacity (FVC) in milliliters (mL) for two groups of participants: the Pirfenidone group with 278 participants and the Placebo group with 277 participants. The chart displays the range of values from -400 mL to 500 mL over a period of 52 weeks.*
FDA Label Image

Figure 3 (Pirfenidone Figure3)

Figure 3 (Pirfenidone Figure3)
This is a clinical trial report comparing the effectiveness of Pirfenidone against Placebo in treating a certain condition. The graph shows the percentage of patients who are still alive during the course of several weeks. The table presents the number of patients who are still in the study at different times.*
FDA Label Image

Chemical Structure (Pirfenidone Structural Formula)

* These product label images have been analyzed using experimental machine learning. Please verify findings with the primary label text.