Lenalidomide Capsule
Product Images NDC 16729-695

View Photos of Packaging, Regulatory Labels, and Product Appearance

Product Visual Gallery

This gallery contains 14 technical images submitted to the FDA as part of the official labeling for Lenalidomide (NDC 16729-695). Unlike standard consumer photos, these assets often include clinical data figures, molecular chemical structures, and official manufacturer packaging layouts.

As provided by Accord Healthcare Inc., these visuals offer a comprehensive scientific overview of the product's physical and chemical identity, aiding pharmacists and researchers in product verification and study.

FDA Label Image

10mg-28capsules (Lenalidomide 10mg Label)
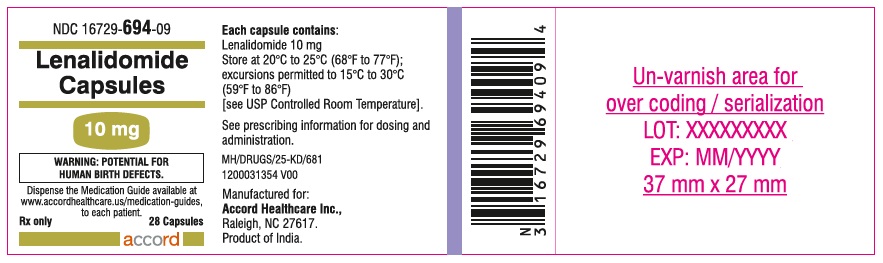
10mg-28capsules (Lenalidomide 10mg Label)
Label for Lenalidomide Capsules 10 mg, an oral prescription drug manufactured by Accord Healthcare Inc. The label indicates 28 capsules per container. It includes a warning about potential human birth defects and storage instructions. The label also displays the National Drug Code (NDC) 16729-694-09 and a barcode.*
FDA Label Image

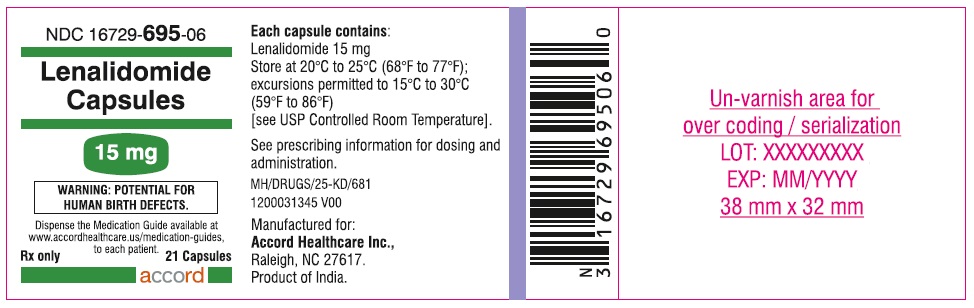
15mg-21capsules (Lenalidomide 15mg Label)

15mg-21capsules (Lenalidomide 15mg Label)
Packaging label for Lenalidomide Capsules 15 mg by Accord Healthcare Inc. The label includes a warning about potential human birth defects, storage instructions, capsule quantity of 21, and states the product is made in India. A barcode and area for lot and expiration date overcoding are also visible.*
FDA Label Image

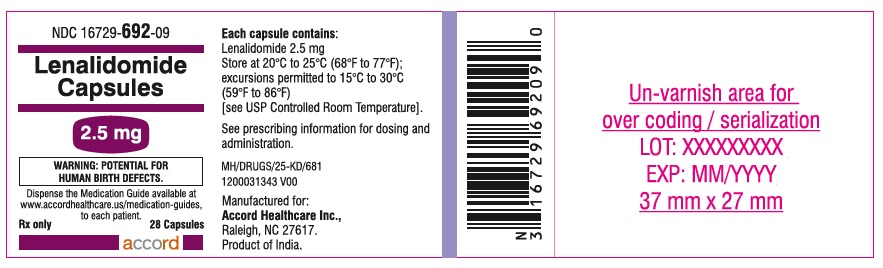
2_5mg-28capsules (Lenalidomide 2 5mg Label)

2_5mg-28capsules (Lenalidomide 2 5mg Label)
Lenalidomide Capsules 2.5 mg oral capsules label by Accord Healthcare Inc. The label shows the active ingredient strength as 2.5 mg per capsule, packaging of 28 capsules, and includes storage instructions and labeling details such as NDC 16729-692-09. It also contains warnings and prescribing information references.*
FDA Label Image

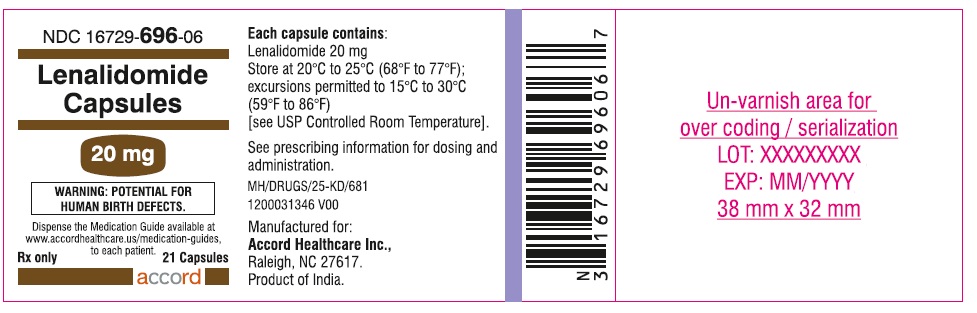
20mg-21capsules (Lenalidomide 20mg Label)

20mg-21capsules (Lenalidomide 20mg Label)
Lenalidomide Capsules 20 mg oral dosage form by Accord Healthcare Inc. The label shows a package containing 21 capsules with a warning about potential human birth defects. Storage instructions specify 20°C to 25°C, with allowable excursions. The label includes a barcode and a space for lot number and expiration date.*
FDA Label Image

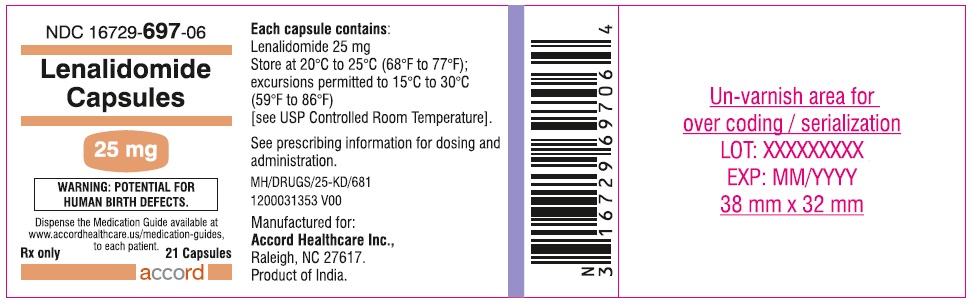
25mg-21capsules (Lenalidomide 25mg Label)

25mg-21capsules (Lenalidomide 25mg Label)
Label for Lenalidomide Capsules 25 mg by Accord Healthcare Inc. The label displays the drug name, strength, a warning about potential human birth defects, and storage instructions. It also states the package contains 21 capsules and includes manufacturer information noting product origin as India.*
FDA Label Image

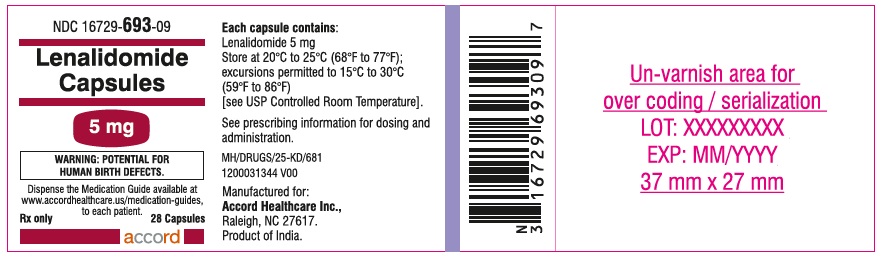
5mg-28capsules (Lenalidomide 5mg Label)

5mg-28capsules (Lenalidomide 5mg Label)
Lenalidomide 5 mg Capsules label from Accord Healthcare Inc. The label states prescription use only with 28 capsules per package. It includes a warning about potential human birth defects and storage instructions at 20°C to 25°C (68°F to 77°F). The label also displays the NDC number 16729-693-09 and a barcode. Lot number and expiration date areas are marked for overcoding and serialization.*
FDA Label Image

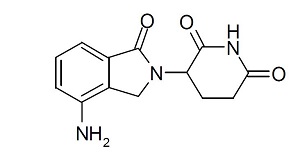
Chemical Structure (Lenalidomide Capsules 01)

Chemical Structure (Lenalidomide Capsules 01)
Chemical structure of lenalidomide showing its molecular framework including a benzene ring with an amino group, a lactam ring, and a second cyclic amide structure.*
FDA Label Image

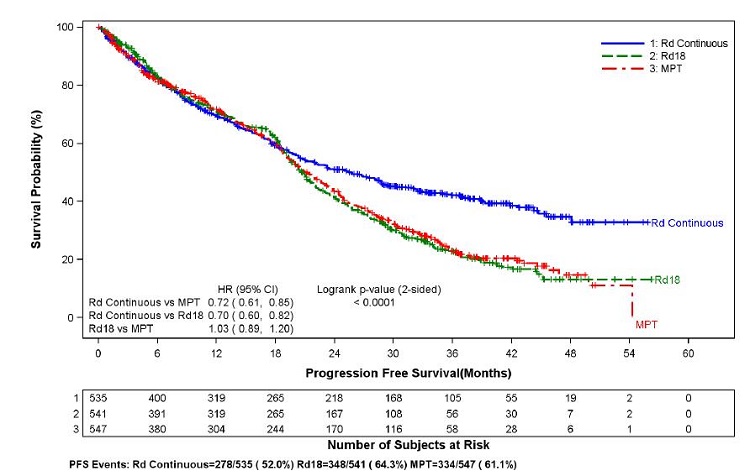
Figure (Lenalidomide Capsules 02)

Figure (Lenalidomide Capsules 02)
A Kaplan-Meier survival curve chart illustrating progression-free survival probability over months for three treatment groups labeled Rd Continuous, Rd18, and MPT. The vertical axis shows survival probability percentage, and the horizontal axis shows time in months up to 60. The chart includes hazard ratios with 95% confidence intervals and a log-rank p-value for statistical comparison, along with a table indicating the number of subjects at risk at various time points for each treatment group.*
FDA Label Image

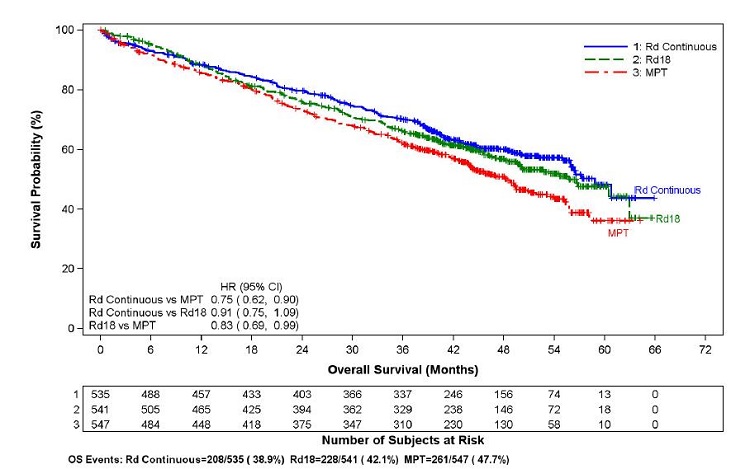
Figure (Lenalidomide Capsules 03)

Figure (Lenalidomide Capsules 03)
A Kaplan-Meier survival curve showing overall survival probability over months for three treatment groups labeled Rd Continuous, Rd18, and MPT. The y-axis represents survival probability (%) and the x-axis represents overall survival in months (0 to 72). A table below the graph provides the number of subjects at risk over time for each group. Hazard ratios (HR) with 95% confidence intervals compare the groups.*
FDA Label Image

Figure (Lenalidomide Capsules 04)

Figure (Lenalidomide Capsules 04)
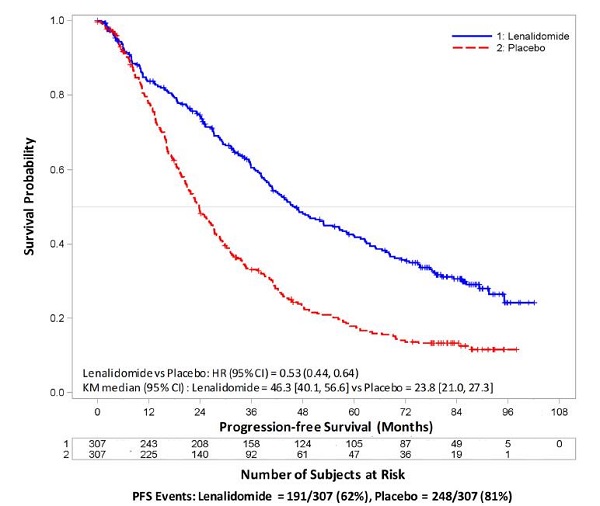
A Kaplan-Meier curve comparing progression-free survival over months between Lenalidomide and placebo groups. The graph shows higher survival probability for Lenalidomide (blue solid line) versus placebo (red dashed line). Below the plot is a table indicating the number of subjects at risk for each group at various time points, along with PFS event counts and percentages for Lenalidomide and placebo.*
FDA Label Image

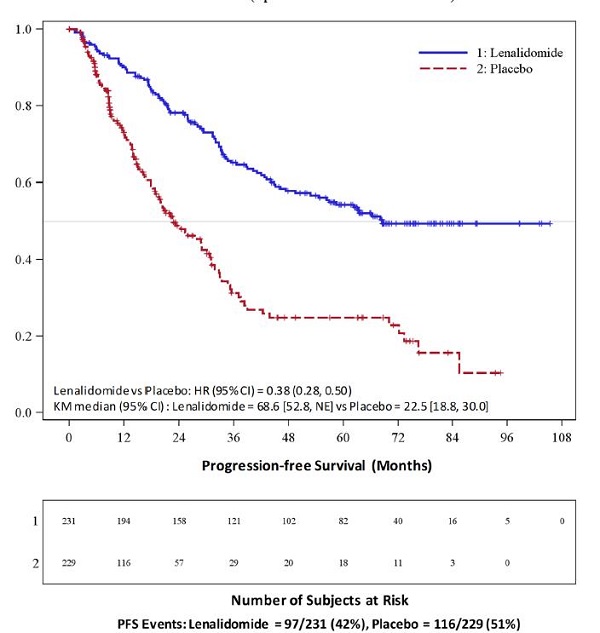
Figure (Lenalidomide Capsules 05)

Figure (Lenalidomide Capsules 05)
A Kaplan-Meier survival curve chart showing progression-free survival probability over months for Lenalidomide and Placebo groups. The y-axis represents survival probability from 0 to 1, and the x-axis shows progression-free survival time in months up to 108 months. The Lenalidomide group curve (blue solid line) remains higher than the Placebo group curve (red dashed line), indicating longer progression-free survival. A table below the graph lists the number of subjects at risk over time for each group.*
FDA Label Image

Figure (Lenalidomide Capsules 06)

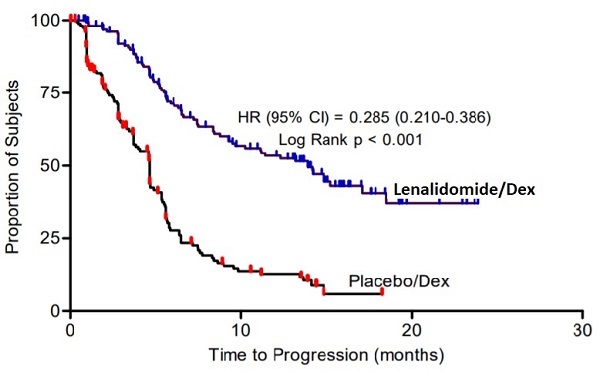
Figure (Lenalidomide Capsules 06)
A Kaplan-Meier survival curve chart showing the time to progression in months on the x-axis and the proportion of subjects on the y-axis. The chart compares two groups: one treated with Lenalidomide combined with Dexamethasone (Lenalidomide/Dex), and the other with Placebo combined with Dexamethasone (Placebo/Dex). The Lenalidomide/Dex group shows a higher proportion of subjects without progression over time compared to the Placebo/Dex group. A hazard ratio (HR) with 95% confidence interval and a log-rank p-value are displayed.*
FDA Label Image

Figure (Lenalidomide Capsules 07)

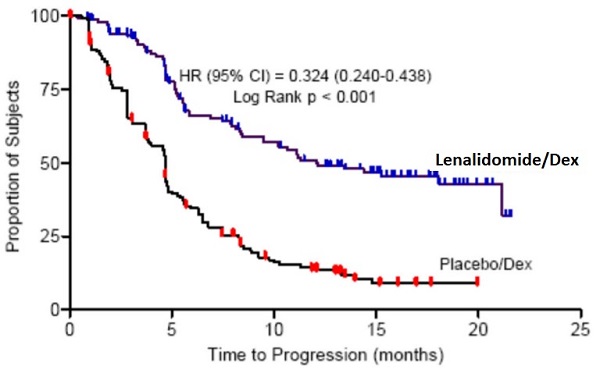
Figure (Lenalidomide Capsules 07)
A Kaplan-Meier survival curve chart comparing time to progression (months) between Lenalidomide/Dexamethasone treatment and Placebo/Dexamethasone treatment. The graph shows the proportion of subjects over time, with Lenalidomide/Dex group exhibiting a higher progression-free survival compared to Placebo/Dex. The chart includes a hazard ratio (HR) with 95% confidence interval and a log-rank p-value indicating statistical significance.*
FDA Label Image

Figure (Lenalidomide Capsules 08)

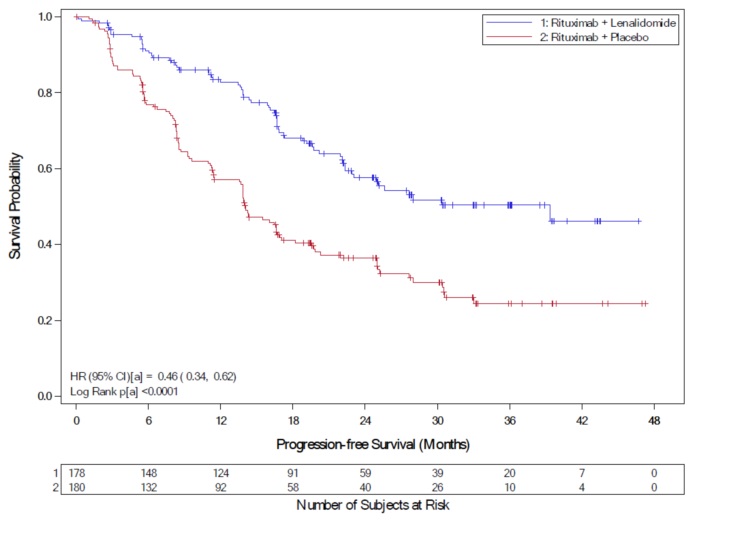
Figure (Lenalidomide Capsules 08)
A Kaplan-Meier survival curve graph showing Progression-free Survival (Months) on the x-axis and Survival Probability on the y-axis. Two treatment groups are compared: Rituximab plus Lenalidomide (blue line) and Rituximab plus Placebo (red line). The graph includes number of subjects at risk over time, hazard ratio with confidence interval, and log-rank p-value.*

* About these descriptions: Image descriptions on this page are generated by automated AI analysis of the product label images from the manufacturer's FDA label submission (SPL). They are provided for reference only and may contain errors or omissions. Always rely on the printed label itself and the official FDA labeling, and consult a pharmacist or healthcare professional with any questions about this product.