Product Images Aripiprazole

View Photos of Packaging, Labels & Appearance

Product Label Images

The following 10 images provide visual information about the product associated with Aripiprazole NDC 17856-0110 by Atlantic Biologicals Corp., such as packaging, labeling, and the appearance of the drug itself. This resource could be helpful for medical professionals, pharmacists, and patients seeking to verify medication information and ensure they have the correct product.

image 1 - 17856 0110 01 LABEL 1

image 1 - 17856 0110 01 LABEL 1

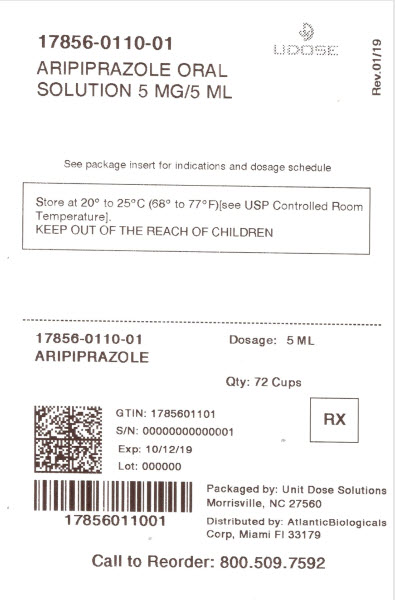
This is a description of Aripiprazole Oral Solution medication with a concentration of 5mg/5ml, with a dosage of 5ml. The package insert contains information about indications and dosage schedules. It is important to keep this medication out of the reach of children. The medication has a GTIN of 1785601101 RX and it is packagend by Unit Dose Solutions in a lot number 000000 with an expiration date of 101210. This medication is distributed by AtlanticBiologicals Corp and for reorders, call 800.509.7592.*

Figure 1: The effects of other drugs on aripiprazole pharmacokinetics - aripiprazole fig1

Figure 1: The effects of other drugs on aripiprazole pharmacokinetics - aripiprazole fig1

This is a figure that shows the effects of other drugs on the pharmacokinetics of aripiprazole. Different drugs and inhibitors are listed along with the fold change and 90% CI of aripiprazole. The drugs listed include CYP3A4 inhibitors, CYP2D6 inhibitors like quinidine, CYP3AL inducers, gastric acid blockers such as famolidine, and other drugs like valroste, lithium, and lorazepam. It is a reference chart indicating the relative change in aripiprazole with and without interacting drugs.*

Figure 2: The effects of other drugs on dehydro-aripiprazole pharmacokinetics - aripiprazole fig2

Figure 2: The effects of other drugs on dehydro-aripiprazole pharmacokinetics - aripiprazole fig2

This is a table presenting the effects of different drugs on the way the body processes aripiprazole. The drugs listed include inhibitors and inducers of the CYP3A4 and CYP2D6 enzymes, gastric acid blockers, and other drugs such as lansoprazole, abiraterone, and esomeprazole. The table shows the fold change and 90% confidence interval for each drug's effect on dehydro-aripiprazole pharmacokinetics.*

Figure 3: The effects of aripiprazole on pharmacokinetics of other drugs - aripiprazole fig3

Figure 3: The effects of aripiprazole on pharmacokinetics of other drugs - aripiprazole fig3

This text appears to be a figure showing the effects of aripiprazole on the pharmacokinetics of various drugs. The drugs listed include warfarin, rovarfarin, omeprazole, lamatigine, valproate, tium, lorazepam, venlafaxine, O-desmethyheniaaine and escitalopram. The figure also shows "fold change and 80% CI" and a chart depicting the "change relative to reference (without interacting drug)."*

Figure 4: Effects of intrinsic factors on aripiprazole pharmacokinetics - aripiprazole fig4

Figure 4: Effects of intrinsic factors on aripiprazole pharmacokinetics - aripiprazole fig4

This is a figure presenting the effects of certain intrinsic factors on the pharmacokinetics of aripiprazole. It shows the fold change and 90% confidence intervals of aripiprazole in various special populations such as those who are poor or extensive metabolizers, female or male, aged 18-106 or 28-65 years old, and those with hepatic or renal impairment. The figure also shows the AUC and Cmax values for each of these populations.*

Figure 5: Effects of intrinsic factors on dehydro-aripiprazole pharmacokinetics - aripiprazole fig5

Figure 5: Effects of intrinsic factors on dehydro-aripiprazole pharmacokinetics - aripiprazole fig5

The text represents a figure (Figure 5) that shows the effects of different intrinsic factors such as metabolizer type, gender, age, hepatic and renal impairment on the pharmacokinetics of dehydro-aripiprazole drug. The graph displays the fold change and 90% Cl with respect to the reference value on the x-axis ranging from 0 to 30. No further information or details are available in the text.*

Figure 6: Kaplan-Meier Estimation of Cumulative Proportion of Patients with Relapse (Schizophrenia Study 5) - aripiprazole fig6

Figure 6: Kaplan-Meier Estimation of Cumulative Proportion of Patients with Relapse (Schizophrenia Study 5) - aripiprazole fig6

This is a graph titled "Kaplan-Meier Estimation of Cumulative Proportion of Patients with Relapse (Schizophrenia Study 5)" which shows the proportion of patients who experienced relapse over time. It compares the results between patients treated with Aripiprazole and those who were treated with a placebo. The graph includes a legend describing the two lines on the plot, and shows the number of subjects at risk for each group at various time points. The x-axis represents the time in days from randomization and the y-axis represents the proportion of subjects experiencing relapse.*

Figure 7: Kaplan-Meier Estimation of Cumulative Proportion of Patients with Relapse (Bipolar Study 7) - aripiprazole fig7

Figure 7: Kaplan-Meier Estimation of Cumulative Proportion of Patients with Relapse (Bipolar Study 7) - aripiprazole fig7

This is a graph (Figure 7) that shows the Kaplan-Meier estimation of the cumulative proportion of patients with relapse in bipolar study 7. The graph has two lines, one for patients treated with aripiprazole and another for patients treated with placebo. The x-axis shows the days from randomization, and the y-axis shows the proportion of patients with relapse. The graph also displays the number of subjects at risk for each treatment group.*

Figure 8: Kaplan-Meier Estimation of Cumulative Proportion of Patients with Relapse to Any Mood Event (Bipolar Study 8) - aripiprazole fig8

Figure 8: Kaplan-Meier Estimation of Cumulative Proportion of Patients with Relapse to Any Mood Event (Bipolar Study 8) - aripiprazole fig8

The figure shows the proportion of patients with relapse in a study comparing aripiprazole and PLACESO for the treatment of bipolar disorder. The Kaplan-Meier estimate of the cumulative proportion of patients with relapse is plotted against the number of days from randomization. The study included 280 subjects and subjects at risk are reported at various time points.*

Chemical Structure - aripiprazole str

Chemical Structure - aripiprazole str

* The product label images have been analyzed using a combination of traditional computing and machine learning techniques. It should be noted that the descriptions provided may not be entirely accurate as they are experimental in nature. Use the information in this page at your own discretion and risk.