Renvela
Product Images NDC 17856-0130

5 FDA label images from Atlantic Biologicals Corps · Packaging, Regulatory Labels, and Product Appearance

Product Visual Gallery

This gallery contains 5 technical images submitted to the FDA as part of the official labeling for Renvela (NDC 17856-0130). Unlike standard consumer photos, these assets often include clinical data figures, molecular chemical structures, and official manufacturer packaging layouts.

As provided by Atlantic Biologicals Corps, these visuals offer a comprehensive scientific overview of the product's physical and chemical identity, aiding pharmacists and researchers in product verification and study.

FDA Label Image

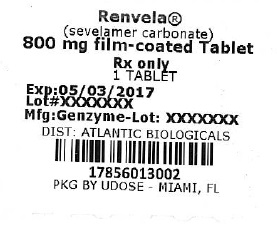
Label Image (Lbl178560130)
Label Image (Lbl178560130)
Label for Renvela 800 mg film-coated tablet containing sevelamer carbonate. Shows prescription status (Rx only), tablet count (1 tablet), expiration date (05/03/2017), lot number placeholder, manufacturer Genzyme, distributor Atlantic Biologicals, and packaging location Miami, FL. Includes barcode and product NDC 17856-0130.*
FDA Label Image

Figure 1 (Renvela 01)

Figure 1 (Renvela 01)
Chemical structure diagram depicting the molecular arrangement of the active ingredient associated with Renvela, showing ammonium, bicarbonate, amino groups, hydroxyl groups, and connecting bonds in a polymer-like layout.*
FDA Label Image

Figure 2 (Renvela 02)

Figure 2 (Renvela 02)
A forest plot chart showing subgroup analyses for a clinical study, with subgroups by screening body surface area (BSA), baseline serum phosphorus, age, and dialysis status. The plot illustrates least squares mean differences with confidence intervals comparing sevelamer carbonate to placebo, including sample sizes and percentages for each subgroup.*
FDA Label Image

Figure 3 (Renvela 03)

Figure 3 (Renvela 03)
A line graph depicting the percentage of patients with reduction in serum phosphorus over time. The x-axis shows reduction in serum phosphorus (mg/dL) ranging from -4 to 8, and the y-axis shows the percentage of patients with reduction varying from 0 to 100%. Two lines represent Sevelamer Hydrochloride and Active Control, illustrating their performance in reducing serum phosphorus compared to baseline.*
FDA Label Image

Figure 4 (Renvela 04)

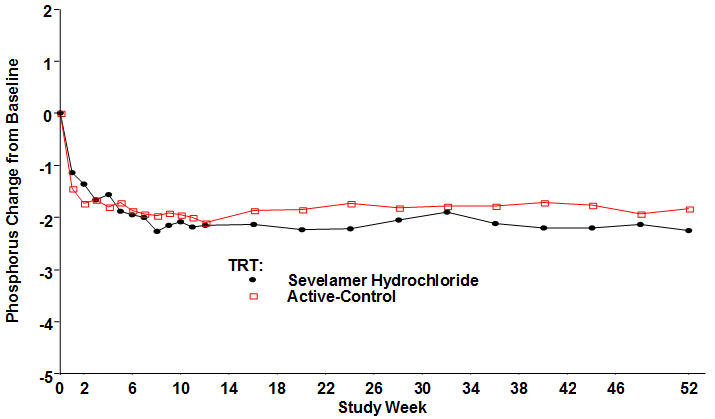
Figure 4 (Renvela 04)
Line graph showing phosphorus change from baseline over 52 study weeks for Sevelamer Hydrochloride compared to an active control. The y-axis measures phosphorus change, while the x-axis represents study weeks. The graph indicates trends in phosphorus levels for each treatment group across the study duration.*

* About these descriptions: Image descriptions on this page are generated by automated AI analysis of the product label images from the manufacturer's FDA label submission (SPL). They are provided for reference only and may contain errors or omissions. Always rely on the printed label itself and the official FDA labeling, and consult a pharmacist or healthcare professional with any questions about this product.