Calcium Acetate
Product Images NDC 17856-0377

View Photos of Packaging, Regulatory Labels, and Product Appearance

Product Visual Gallery

This gallery contains 5 technical images submitted to the FDA as part of the official labeling for Calcium Acetate (NDC 17856-0377). Unlike standard consumer photos, these assets often include clinical data figures, molecular chemical structures, and official manufacturer packaging layouts.

As provided by Atlantic Biologicals Corps, these visuals offer a comprehensive scientific overview of the product's physical and chemical identity, aiding pharmacists and researchers in product verification and study.

FDA Label Image

Label Image (17856 0377)

Label Image (17856 0377)
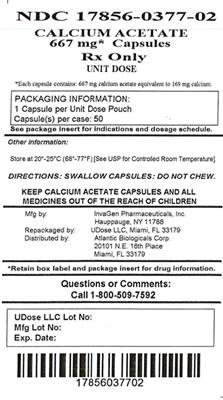
This is a description of a medication with the National Drug Code (NDC) 17856-0377-02. The medication is Calcium Acetate and comes in the form of capsules. Each capsule contains 667 mg of the medication. It is only available with a prescription. The packaging information indicates that it is available in unit dose packaging and comes in packs of 7 capsules or in a box called "Corstrip". The text also provides a phone number for any questions or comments related to the medication. There is some text that is not readable, marked as "aw e" and "Exp e".*
FDA Label Image

Structure (Structure)

FDA Label Image

Table 1 (Table1)

Table 1 (Table1)
This is a table showing adverse reactions in patients with end-stage renal disease undergoing hemodialysis. The table lists different types of adverse reactions such as Nausea, Vomiting, and Hypercalcemia. It also lists the number of total adverse reactions reported and the percentage of patients who experienced those reactions. It includes data from a 3-month open-label study of calcium acetate and a double blind, placebo-controlled, cross-over study of liquid calcium.*
FDA Label Image

Table 2 (Table2)

Table 2 (Table2)
Table 2 shows the average serum phosphorous and calcium levels at pre-study, interim, and study completion time points. The mean phosphorus levels at week 4, week 8, and week 12 were 74.0 mg/dL, 59.0 mg/dL, and 56.0 mg/dL, respectively, with a significant p-value of <0.001. On the other hand, the mean calcium levels at pre-study, week 4, week 8, and week 12 were 8.92 mg/dL, 9.50 mg/dL, 9.70 mg/dL, and 9.70 mg/dL, respectively, with a non-significant p-value of =0.001. Note that the values presented are expressed as mean = SE, and the study included ninety-one patients who completed at least 6 weeks of the study. The difference in values at pre-study and study completion was analyzed using ANOVA.*
FDA Label Image

Table 3 (Table3)

Table 3 (Table3)
This is a table displaying the serum phosphorus and calcium levels before and after each treatment arm. The parameters measured were Phosphorus and Calcium levels in mg/dL. The values were expressed as mean and standard error of the mean (SEM). The study was comparing Calcium Acetate treatment to Placebo treatment. ANOVA was used to analyze the data after 2 weeks of treatment.*

* These product label images have been analyzed using experimental machine learning. Please verify findings with the primary label text.