Levetiracetam
Product Images NDC 17856-0865

11 FDA label images from Atlantic Biologicals Corps · Packaging, Regulatory Labels, and Product Appearance

Product Visual Gallery

This gallery contains 11 technical images submitted to the FDA as part of the official labeling for Levetiracetam (NDC 17856-0865). Unlike standard consumer photos, these assets often include clinical data figures, molecular chemical structures, and official manufacturer packaging layouts.

As provided by Atlantic Biologicals Corps, these visuals offer a comprehensive scientific overview of the product's physical and chemical identity, aiding pharmacists and researchers in product verification and study.

FDA Label Image

Section 2.2 Calculation (880573dc 0dcf 4c7d 9e58 A927f472feaf 01)

Section 2.2 Calculation (880573dc 0dcf 4c7d 9e58 A927f472feaf 01)
An instructional formula for calculating total daily dose (mL/day) of Levetiracetam, showing it as the daily dose in mg/kg/day multiplied by patient weight in kg divided by 100 mg/mL concentration.*

FDA Label Image

Section 2.5 Calculation 1 (880573dc 0dcf 4c7d 9e58 A927f472feaf 02)

Section 2.5 Calculation 1 (880573dc 0dcf 4c7d 9e58 A927f472feaf 02)
A formula diagram showing the calculation of creatinine clearance (CLcr) using age, weight, serum creatinine, with an adjustment factor of 0.85 for female patients.*
FDA Label Image

Section 2.5 Calculation 2 (880573dc 0dcf 4c7d 9e58 A927f472feaf 03)

Section 2.5 Calculation 2 (880573dc 0dcf 4c7d 9e58 A927f472feaf 03)
Chemical structure depicting a formula used for calculating creatinine clearance (CLcr) adjusted for body surface area (BSA). The formula shows CLcr (mL/min/1.73m²) equals CLcr (mL/min) divided by the subject's BSA (m²), multiplied by 1.73.*
FDA Label Image

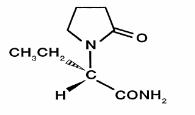
Structure (880573dc 0dcf 4c7d 9e58 A927f472feaf 04)

Structure (880573dc 0dcf 4c7d 9e58 A927f472feaf 04)
Chemical structure diagram of Levetiracetam, showing its molecular framework with a pyrrolidone ring and side chains including an ethyl group and an amide functional group.*
FDA Label Image

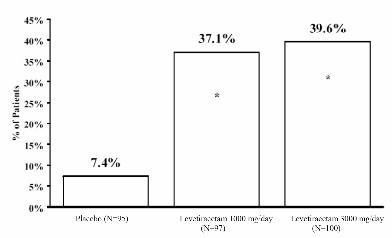
Figure 1 (880573dc 0dcf 4c7d 9e58 A927f472feaf 05)

Figure 1 (880573dc 0dcf 4c7d 9e58 A927f472feaf 05)
A bar chart comparing the percentage of patients across three groups: placebo, levetiracetam 1000 mg/day, and levetiracetam 3000 mg/day. The chart shows increasing percentages of patients with 7.4% for placebo, 37.1% for 1000 mg/day, and 39.6% for 3000 mg/day, indicating a trend related to levetiracetam dosing.*
FDA Label Image

Figure 2 (880573dc 0dcf 4c7d 9e58 A927f472feaf 06)

Figure 2 (880573dc 0dcf 4c7d 9e58 A927f472feaf 06)
A bar chart showing the percentage of patients by treatment group, including placebo, levetiracetam 1000 mg/day, and levetiracetam 2000 mg/day. The vertical axis represents the percentage of patients, and the chart compares the three groups visually with corresponding percentages labeled on each bar.*
FDA Label Image

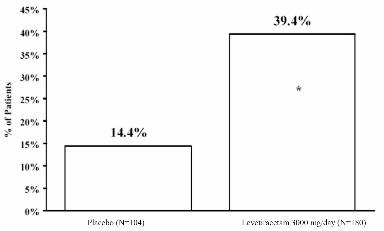
Figure 3 (880573dc 0dcf 4c7d 9e58 A927f472feaf 07)

Figure 3 (880573dc 0dcf 4c7d 9e58 A927f472feaf 07)
A bar chart comparing the percentage of patients between placebo and Levetiracetam 300 mg/day groups. The placebo group has approximately 14.4% of patients, while the Levetiracetam group shows about 39.4% of patients. Each bar is labeled with the respective percentage.*
FDA Label Image

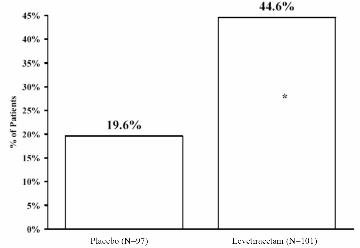
Figure 4 (880573dc 0dcf 4c7d 9e58 A927f472feaf 08)

Figure 4 (880573dc 0dcf 4c7d 9e58 A927f472feaf 08)
A bar chart comparing the percentage of patients responding to treatment between Placebo and Levetiracetam groups. The vertical axis represents the percentage of patients, with Placebo showing 19.6% and Levetiracetam showing 44.6%. The chart quantifies patient response rates for these two groups.*
FDA Label Image

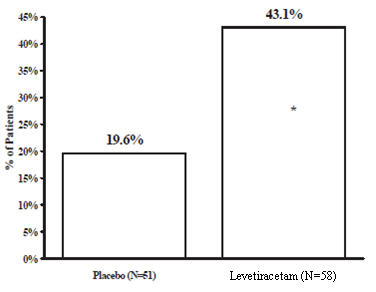
Figure 5 (880573dc 0dcf 4c7d 9e58 A927f472feaf 09)

Figure 5 (880573dc 0dcf 4c7d 9e58 A927f472feaf 09)
A bar chart comparing the percentage of patients between placebo and Levetiracetam groups. The placebo group shows 19.6% while the Levetiracetam group shows 43.1%. The x-axis labels the groups with sample sizes and the y-axis represents the percentage of patients, ranging from 0% to 45%.*
FDA Label Image

Figure 5 (880573dc 0dcf 4c7d 9e58 A927f472feaf 10)

Figure 5 (880573dc 0dcf 4c7d 9e58 A927f472feaf 10)
A bar chart comparing the percentage of patients between a placebo group and a Levetiracetam group. The chart shows approximately 45.2% of patients in the placebo group and 72.2% in the Levetiracetam group. The x-axis labels the two groups, while the y-axis represents the percentage of patients from 0% to 100%.*
FDA Label Image

Label Image (Rspl17856 0865)

Label Image (Rspl17856 0865)
Label for Levetiracetam oral solution 500 mg per 5 mL by Atlantic Biologicals Corps. The label specifies it is prescription only and delivers 5 mL per dose. Includes expiration date, lot number placeholders, and packaging information by Udose in Miami, FL. The product NDC 17856-0865 is shown with a barcode.*

* About these descriptions: Image descriptions on this page are generated by automated AI analysis of the product label images from the manufacturer's FDA label submission (SPL). They are provided for reference only and may contain errors or omissions. Always rely on the printed label itself and the official FDA labeling, and consult a pharmacist or healthcare professional with any questions about this product.