Cialis
Product Images NDC 21695-028

View Photos of Packaging, Regulatory Labels, and Product Appearance

Product Visual Gallery

This gallery contains 6 technical images submitted to the FDA as part of the official labeling for Cialis (NDC 21695-028). Unlike standard consumer photos, these assets often include clinical data figures, molecular chemical structures, and official manufacturer packaging layouts.

As provided by Rebel Distributors Corp., these visuals offer a comprehensive scientific overview of the product's physical and chemical identity, aiding pharmacists and researchers in product verification and study.

FDA Label Image

Package Label (029)

Package Label (029)
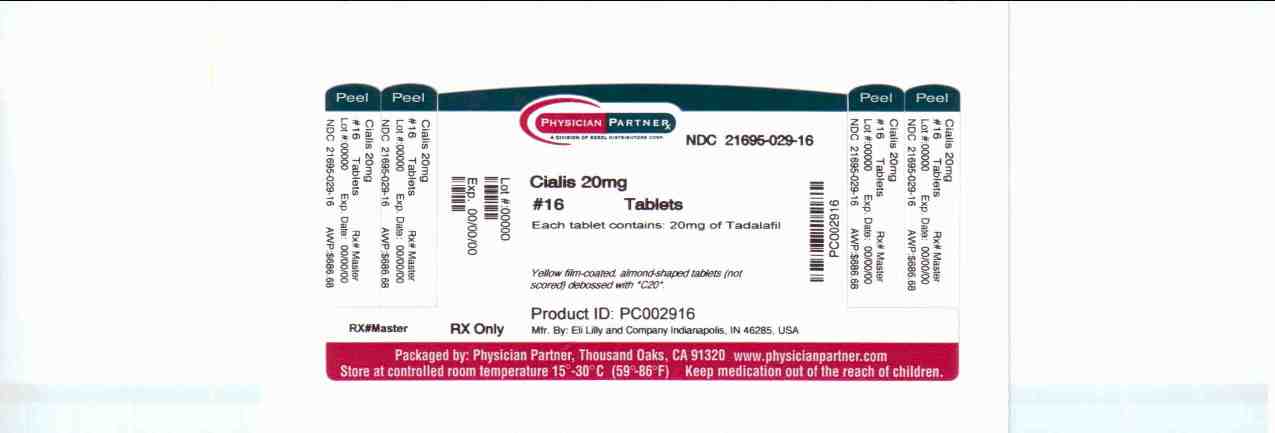
The image shows a packaging label for Cialis 20mg tablets. The label indicates there are 16 tablets per package, each containing 20mg of Tadalafil. The label features the Physician Partner logo and includes storage instructions to keep the medication at controlled room temperature (15-30°C). The product is labeled as RX Only and manufactured by Eli Lilly and Company, with packaging by Physician Partner, Thousand Oaks, CA.*
FDA Label Image

Chemical Structure (Cialis Uspi F001 Structure V1)

Chemical Structure (Cialis Uspi F001 Structure V1)
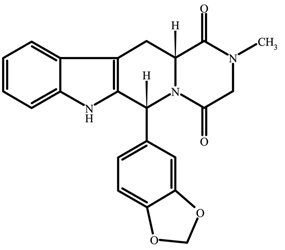
Chemical structure diagram of the active ingredient in Cialis, showing its molecular composition with labeled atoms and bonds.*
FDA Label Image

Figure (Cialis Uspi F001 V2)

Figure (Cialis Uspi F001 V2)
A line graph showing plasma tadalafil concentration (µg/L) over time (hours) for Cialis. It compares single 20-mg dose, single 5-mg dose, and once-daily 5-mg dosing after 5 days. Concentration peaks shortly after dosing and declines over 120 hours, with error bars indicating variability.*
FDA Label Image

Figure (Cialis Uspi F002 V1)

Figure (Cialis Uspi F002 V1)
Four line charts depicting the difference in blood pressure (BP) measurements between Tadalafil and placebo over time in hours (0, 4, 8, 24, 48, 72, 96). The charts show standing systolic BP, standing diastolic BP, supine systolic BP, and supine diastolic BP with differences plotted in mmHg along the vertical axis and time along the horizontal axis, each including error bars.*
FDA Label Image

Figure (Cialis Uspi F003 V1)

Figure (Cialis Uspi F003 V1)
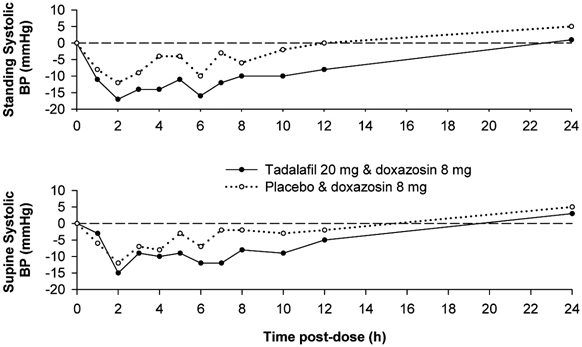
Two line graphs plotting standing and supine systolic blood pressure (BP) changes (mmHg) over 24 hours post-dose. The graphs compare Tadalafil 20 mg with doxazosin 8 mg (solid line) versus placebo with doxazosin 8 mg (dotted line). Time post-dose is shown on the x-axis and BP change on the y-axis.*
FDA Label Image

Figure (Cialis Uspi F004 V1)

Figure (Cialis Uspi F004 V1)
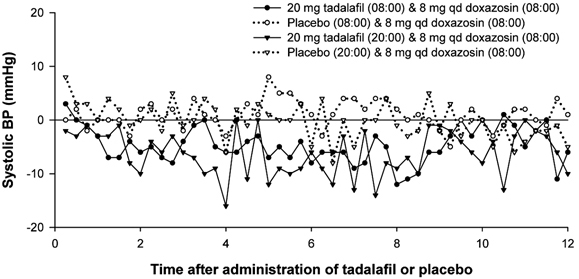
A line graph showing the effect of 20 mg tadalafil with 8 mg doxazosin versus placebo with 8 mg doxazosin on systolic blood pressure (mmHg) over 12 hours. Four lines represent measurements at 08:00 and 20:00 dosings for both tadalafil and placebo groups, illustrating changes in systolic BP post-administration.*

* About these descriptions: Image descriptions on this page are generated by automated AI analysis of the product label images from the manufacturer's FDA label submission (SPL). They are provided for reference only and may contain errors or omissions. Always rely on the printed label itself and the official FDA labeling, and consult a pharmacist or healthcare professional with any questions about this product.