Androgel
Product Images NDC 21695-112

View Photos of Packaging, Regulatory Labels, and Product Appearance

Product Visual Gallery

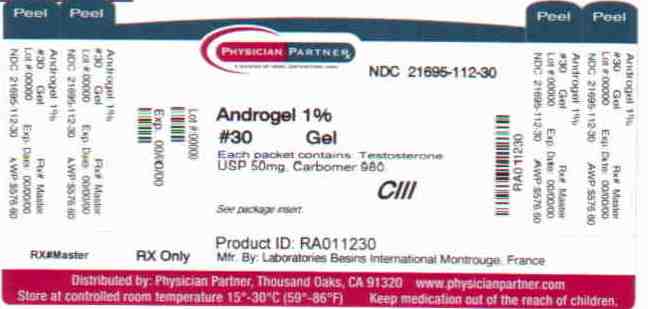
This gallery contains 5 technical images submitted to the FDA as part of the official labeling for Androgel (NDC 21695-112). Unlike standard consumer photos, these assets often include clinical data figures, molecular chemical structures, and official manufacturer packaging layouts.

As provided by Rebel Distributors Corp., these visuals offer a comprehensive scientific overview of the product's physical and chemical identity, aiding pharmacists and researchers in product verification and study.

FDA Label Image

Image Of Androgel (testosterone Gel) Chemical Structure (77215d87 Ad22 4169 Bd5f A453f10b21ef 01)

FDA Label Image

Image Of Figure 1 Graph (77215d87 Ad22 4169 Bd5f A453f10b21ef 02)

FDA Label Image

Image Of Figure 2 Graph (77215d87 Ad22 4169 Bd5f A453f10b21ef 03)

Image Of Figure 2 Graph (77215d87 Ad22 4169 Bd5f A453f10b21ef 03)
This appears to be a chart representing the testosterone concentration (in ng/dL) over time (in hours) after application. The chart includes a range of values from 0-500 ng/dL and shows measurements at specific timepoints up to 24 hours after application.*
FDA Label Image

Image Of Figure 3: Site(s) Of Gel Application (77215d87 Ad22 4169 Bd5f A453f10b21ef 04)

FDA Label Image

Androgel 1% (77215d87 Ad22 4169 Bd5f A453f10b21ef 05)

* These product label images have been analyzed using experimental machine learning. Please verify findings with the primary label text.