Image Of Namenda Chemical Structure (74ce605d B493 4b95 9d59 9253f81f4e20 01)
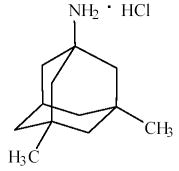
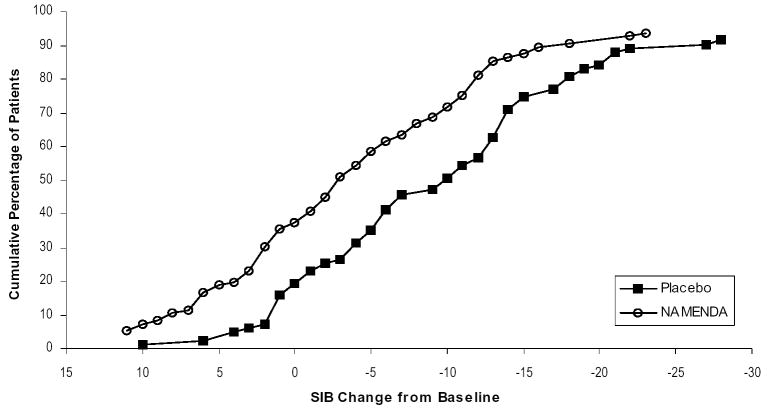
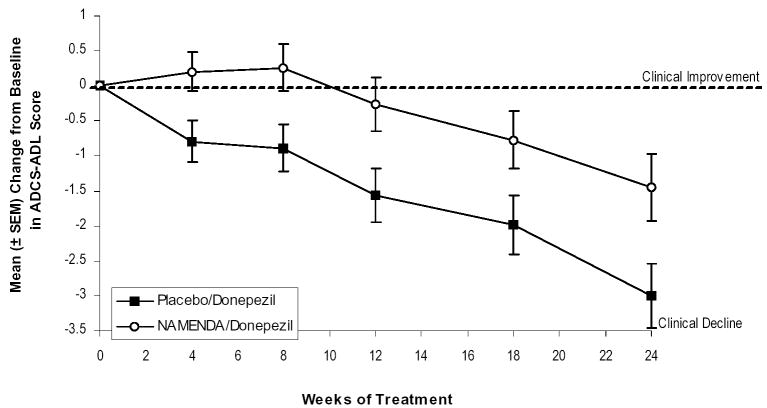
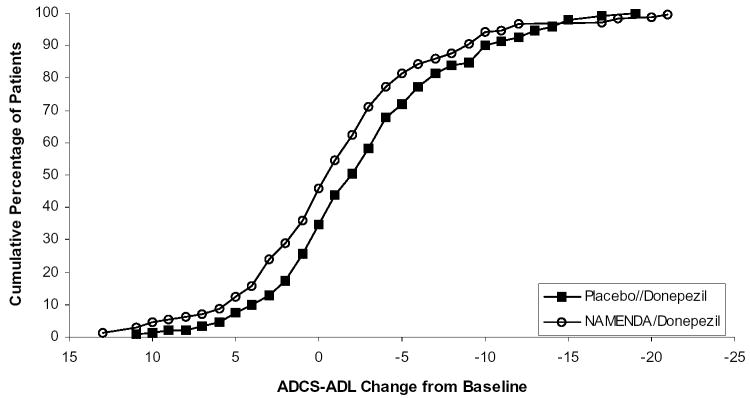
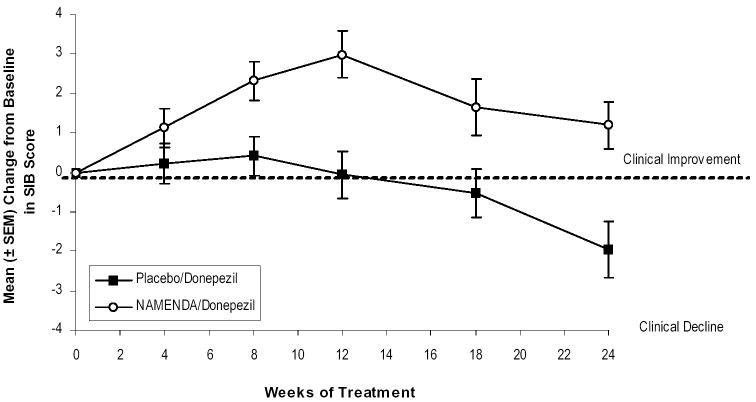
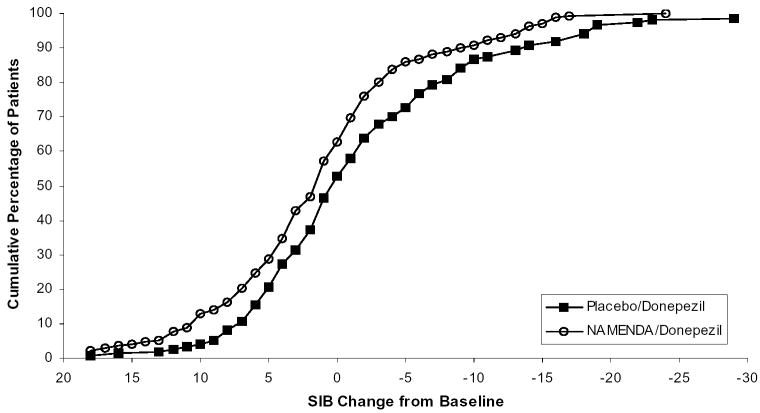
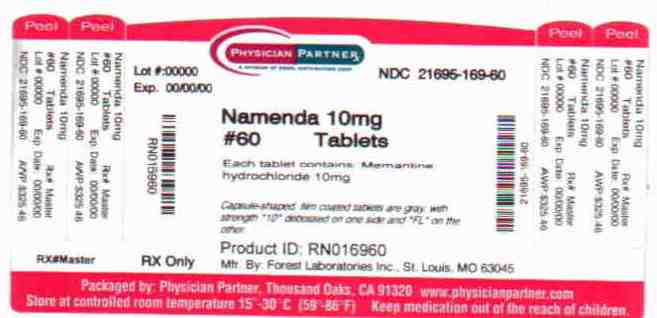
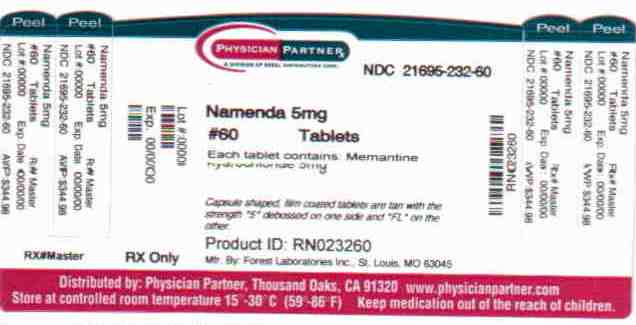
This gallery contains 11 technical images submitted to the FDA as part of the official labeling for Namenda (NDC 21695-232). Unlike standard consumer photos, these assets often include clinical data figures, molecular chemical structures, and official manufacturer packaging layouts.
As provided by Rebel Distributors Corp, these visuals offer a comprehensive scientific overview of the product's physical and chemical identity, aiding pharmacists and researchers in product verification and study.
* These product label images have been analyzed using experimental machine learning. Please verify findings with the primary label text.