Razadyne
Product Images NDC 21695-591
View Photos of Packaging, Regulatory Labels, and Product Appearance
Product Visual Gallery
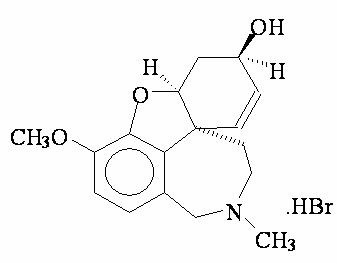
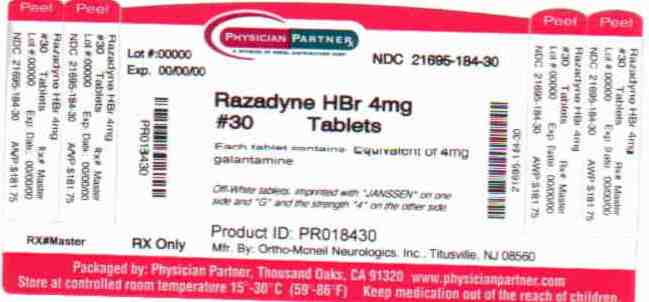
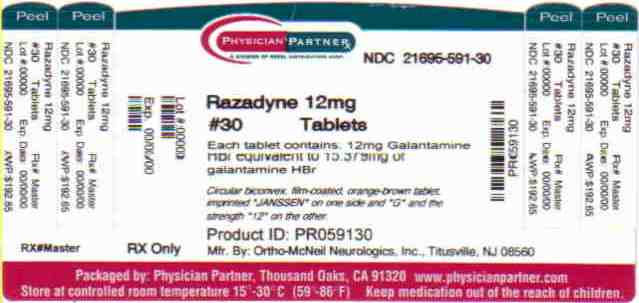
This gallery contains 15 technical images submitted to the FDA as part of the official labeling for Razadyne (NDC 21695-591). Unlike standard consumer photos, these assets often include clinical data figures, molecular chemical structures, and official manufacturer packaging layouts.
As provided by Rebel Distributors Corp, these visuals offer a comprehensive scientific overview of the product's physical and chemical identity, aiding pharmacists and researchers in product verification and study.
Product Images & Figures Index
Graph 1 (Ea6968e3 6383 4ff1 8c81 E4a2fdfe749d 02)
Graph 2 (Ea6968e3 6383 4ff1 8c81 E4a2fdfe749d 03)
The text seems to be a chart that displays the cumulative percentage of patients and ADAS-cog changes from baseline. The chart shows three different dosages: placebo, 16 my/day, and 34 my/day. On the left, there is a vertical column with percentages from 0 to 100. The bottom of the chart shows the ADAS-cog change from baseline ranging from -15 to +15. The text is not available to explain the meaning of ADAS-cog.*
Graph 3 (Ea6968e3 6383 4ff1 8c81 E4a2fdfe749d 04)
Graph 4 (Ea6968e3 6383 4ff1 8c81 E4a2fdfe749d 05)
Graph 5 (Ea6968e3 6383 4ff1 8c81 E4a2fdfe749d 06)
This is a graph that shows the cumulative percentage of patients based on ADAS-cog (Alzheimer's Disease Assessment Scale-Cognitive Subscale) change from baseline. The graph compares the effects of two drugs, 24 mg/day and 32 mg/day, with a placebo. The X-axis shows the change values in ADAS-cog, ranging from -10 points to +15 points, with 0 being the baseline. The Y-axis shows the cumulative percentage of patients experiencing changes within each range.*
Graph 6 (Ea6968e3 6383 4ff1 8c81 E4a2fdfe749d 07)
Graph 7 (Ea6968e3 6383 4ff1 8c81 E4a2fdfe749d 08)
Graph 8 (Ea6968e3 6383 4ff1 8c81 E4a2fdfe749d 09)
This is a graph displaying the cumulative percentage of patients based on the ADAS-cog change from baseline. There are data points marked at -4 points, 7 points, and -10 points, and the x-axis displays the range of change in ADAS-cog scores from -15 to +15. There is also information on the drug regimen used, with a dosage of 4 mg/day for some patients and 5 mg/day for others.*
Graph 9 (Ea6968e3 6383 4ff1 8c81 E4a2fdfe749d 10)
Graph 10 (Ea6968e3 6383 4ff1 8c81 E4a2fdfe749d 11)
Graph 11 (Ea6968e3 6383 4ff1 8c81 E4a2fdfe749d 12)
Graph 12 (Ea6968e3 6383 4ff1 8c81 E4a2fdfe749d 13)
Razadyne Hbr 4mg (Ea6968e3 6383 4ff1 8c81 E4a2fdfe749d 14)
Razadyne 12mg (Ea6968e3 6383 4ff1 8c81 E4a2fdfe749d 15)
* These product label images have been analyzed using experimental machine learning. Please verify findings with the primary label text.