Testosterone Gel
Product Images NDC 21922-030

View Photos of Packaging, Regulatory Labels, and Product Appearance

Product Visual Gallery

This gallery contains 7 technical images submitted to the FDA as part of the official labeling for Testosterone (NDC 21922-030). Unlike standard consumer photos, these assets often include clinical data figures, molecular chemical structures, and official manufacturer packaging layouts.

As provided by Encube Ethicals, Inc., these visuals offer a comprehensive scientific overview of the product's physical and chemical identity, aiding pharmacists and researchers in product verification and study.

FDA Label Image

Carton (Carton)

Carton (Carton)
Packaging label for Testosterone gel 1.62% transdermal gel, 88 g net quantity, labeled by Encube Ethicals, Inc. The label includes dosing information, warnings about alcohol-based gels being flammable, storage instructions, and manufacturer details in India and the USA. It also features the NDC 21922-030 and indicates Rx use only.*
FDA Label Image

Graph 1 (Graph 1)

Graph 1 (Graph 1)
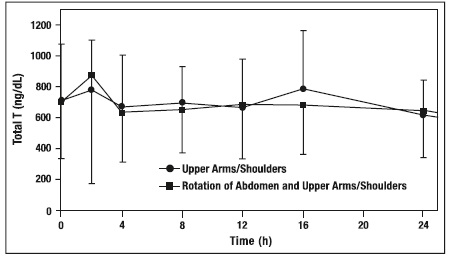
A line graph illustrating total testosterone levels (ng/dL) over 24 hours, with measurements at various time points up to 24 hours. Two data series are shown: one for application on upper arms/shoulders and the other for rotation of abdomen and upper arms/shoulders, comparing testosterone levels over time.*
FDA Label Image

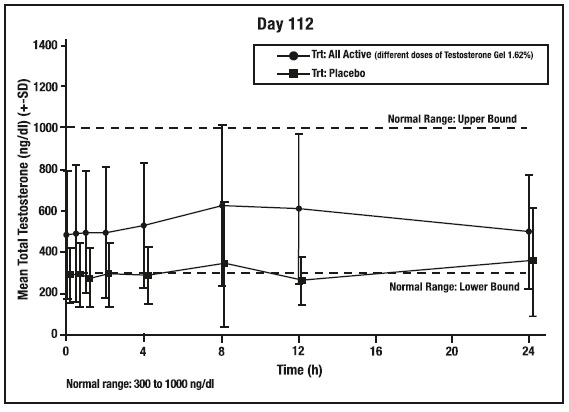
Graph 2 (Graph 2)

Graph 2 (Graph 2)
A line graph depicting mean total testosterone levels (ng/dl) over a 24-hour period on Day 112, comparing active treatment with different doses of Testosterone Gel 1.62% versus placebo. The y-axis shows testosterone levels from 0 to 1400 ng/dl, with marked normal range bounds (300 to 1000 ng/dl), and the x-axis shows time in hours (0 to 24). Data includes error bars indicating variability.*
FDA Label Image

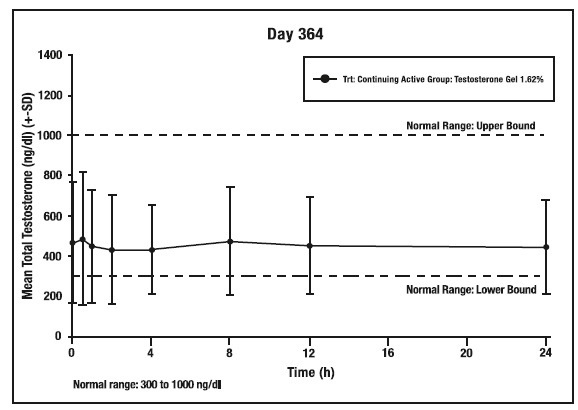
Graph 3 (Graph 3)

Graph 3 (Graph 3)
A line graph showing the mean total testosterone levels (ng/dl) with standard deviation over 24 hours on Day 364 for a continuing active group treated with Testosterone Gel 1.62%. The y-axis represents testosterone concentration from 0 to 1400 ng/dl, with normal range bounds marked at 300 and 1000 ng/dl. The x-axis represents time in hours from 0 to 24. Data points are plotted with error bars, mostly within the normal testosterone range.*
FDA Label Image

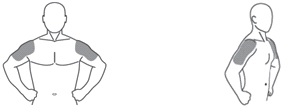
Img 1 (Img 1)

Img 1 (Img 1)
An illustration showing the indicated application sites for testosterone transdermal gel. The gel is applied to the upper arms and shoulders on a standing male figure, viewed from front and side angles.*
FDA Label Image

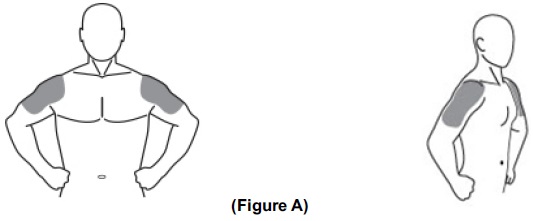
Img 2 (Img 2)

Img 2 (Img 2)
An illustration showing the recommended application sites for testosterone transdermal gel, highlighting both shoulders on a male figure from front and side views. The shaded areas indicate where to apply the gel.*
FDA Label Image

Structure (Structure)

Structure (Structure)
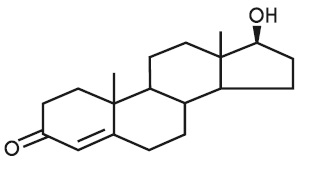
Chemical structure diagram of testosterone, the active ingredient in the product TESTOSTERONE 16.2 mg/g transdermal gel by Encube Ethicals, Inc.*

* About these descriptions: Image descriptions on this page are generated by automated AI analysis of the product label images from the manufacturer's FDA label submission (SPL). They are provided for reference only and may contain errors or omissions. Always rely on the printed label itself and the official FDA labeling, and consult a pharmacist or healthcare professional with any questions about this product.