Glipizide And Metformin Hcl Tablet, Film Coated
Product Images NDC 23155-116
View Photos of Packaging, Regulatory Labels, and Product Appearance
Product Visual Gallery
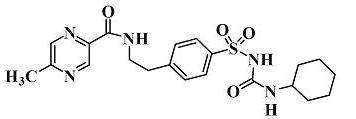
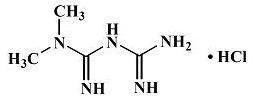
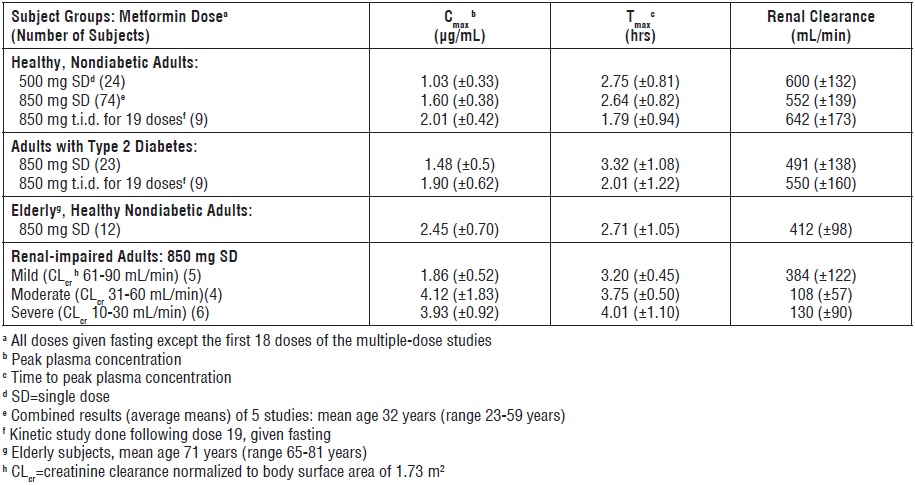
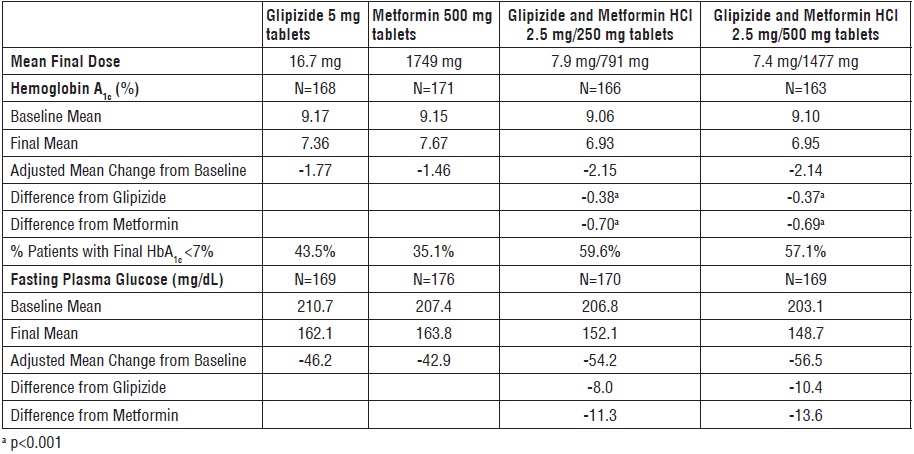
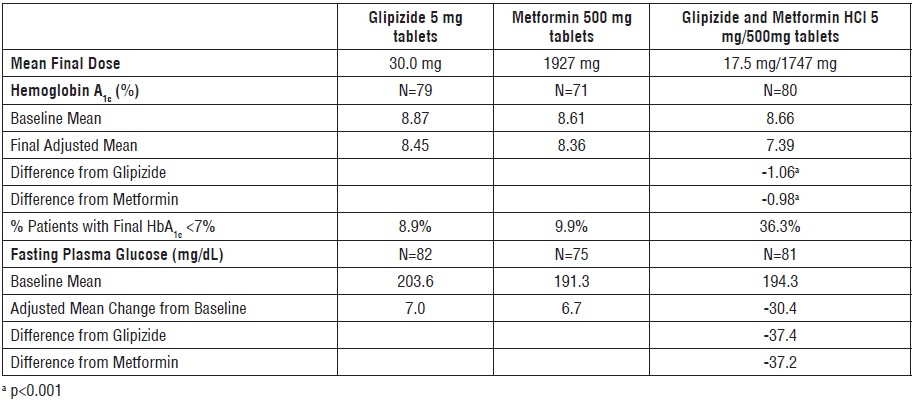
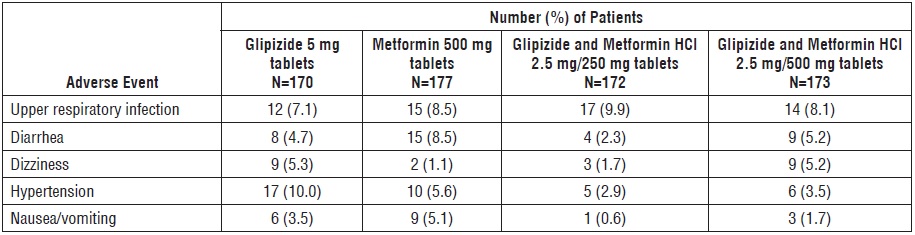
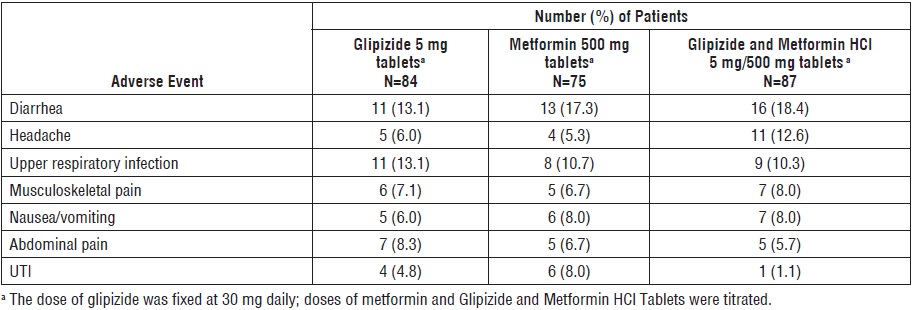
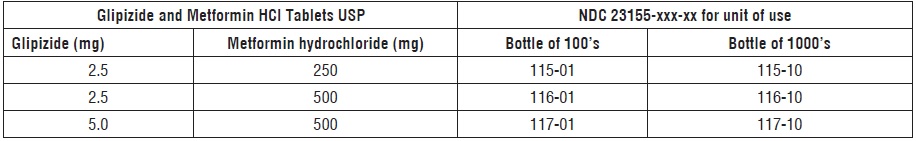
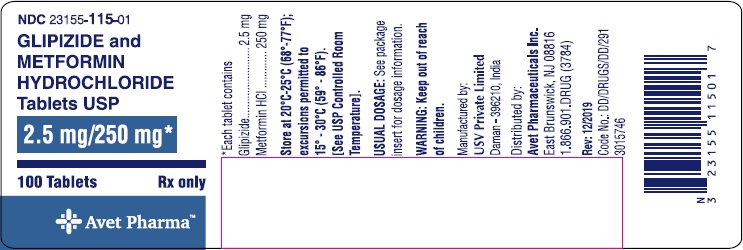
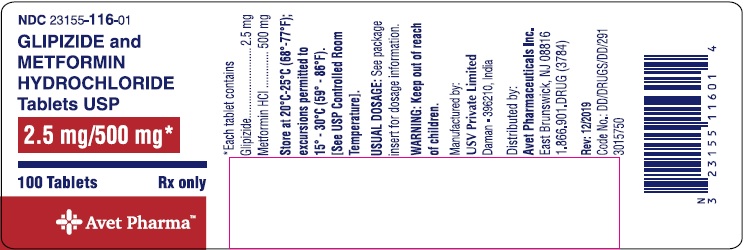
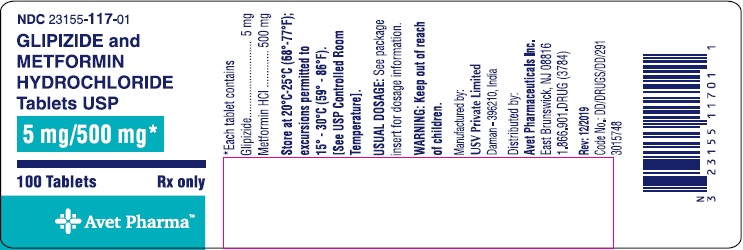
This gallery contains 13 technical images submitted to the FDA as part of the official labeling for Glipizide And Metformin Hcl (NDC 23155-116). Unlike standard consumer photos, these assets often include clinical data figures, molecular chemical structures, and official manufacturer packaging layouts.
As provided by Heritage Pharmaceuticals Inc. D/b/a Avet Pharmaceuticals Inc., these visuals offer a comprehensive scientific overview of the product's physical and chemical identity, aiding pharmacists and researchers in product verification and study.
Product Images & Figures Index
Ee5fdf68 Df2d 4965 8224 2c2df30f2f22 02
Ee5fdf68 Df2d 4965 8224 2c2df30f2f22 03
This is a table showing the Metformin Dose vs Renal Clearance, including the number of subjects, peak plasma concentration, time to peak plasma concentration, and creatinine clearance of healthy adults (both diabetic and non-diabetic), elderly and renal-impaired adults. The data suggests that the dose should be adjusted based on the patient's renal function.*
Ee5fdf68 Df2d 4965 8224 2c2df30f2f22 04
This is a table showing the dosage and efficacy of Glipizide and Metformin HCI tablets in treating patients with type 2 diabetes. The table includes information on mean final doses, Hemoglobin A1c levels, and fasting plasma glucose levels for various dosages of the medication. The table also includes differences in efficacy compared to Glipizide and Metformin alone, as well as the percentage of patients who achieved a final Hemoglobin A1c level below 7%.*
Ee5fdf68 Df2d 4965 8224 2c2df30f2f22 05
This is a comparison of Glipizide, Metformin, and Glipizide and Metformin HCI. The table shows mean final dose, Hemoglobin A and % of patients with HbA__<7%, Fasting Plasma Glucose, and their differences from each other. Adjusted Mean Change from Baseline is also shown. The results of the comparison are statistically significant with p<0.001.*
Ee5fdf68 Df2d 4965 8224 2c2df30f2f22 06
This is a table showing the number and percentage of patients with various adverse events related to Glipizide and Metformin HCI in different tablet strengths (2.5 mg/250 mg and 2.5 mg/500 mg) as well as Glipizide 5mg and Metformin 500mg tablets. Adverse events include upper respiratory infection, diarrhea, dizziness, hypertension, nausea, and vomiting. No additional context or information is available.*
Ee5fdf68 Df2d 4965 8224 2c2df30f2f22 07
This appears to be a table showing the incidence of various adverse events in patients taking different types of tablets - Glipizide 5 mg tablets, Metformin 500 mg tablets, and Glipizide and Metformin HCI tablets. The number of patients for each type of tablet is listed, followed by the percentage of those patients who experienced each adverse event. Some of the adverse events listed include diarrhea, headache, upper respiratory infection, musculoskeletal pain, and nausea/vomiting. It also notes that the dose of glipizide was fixed at 30 mg daily, while doses of metformin and Glipizide and Metformin HCI Tablets were titrated.*
Ee5fdf68 Df2d 4965 8224 2c2df30f2f22 08
Ee5fdf68 Df2d 4965 8224 2c2df30f2f22 09
Ee5fdf68 Df2d 4965 8224 2c2df30f2f22 10
Ee5fdf68 Df2d 4965 8224 2c2df30f2f22 11
Ee5fdf68 Df2d 4965 8224 2c2df30f2f22 12
Ee5fdf68 Df2d 4965 8224 2c2df30f2f22 13
* These product label images have been analyzed using experimental machine learning. Please verify findings with the primary label text.