Tetrabenazine Tablet
Product Images NDC 23155-939

7 FDA label images from Heritage Pharmaceuticals Inc. D/b/a Avet Pharmaceuticals Inc. · Packaging, Regulatory Labels, and Product Appearance

Product Visual Gallery

This gallery contains 7 technical images submitted to the FDA as part of the official labeling for Tetrabenazine (NDC 23155-939). Unlike standard consumer photos, these assets often include clinical data figures, molecular chemical structures, and official manufacturer packaging layouts.

As provided by Heritage Pharmaceuticals Inc. D/b/a Avet Pharmaceuticals Inc., these visuals offer a comprehensive scientific overview of the product's physical and chemical identity, aiding pharmacists and researchers in product verification and study.

FDA Label Image

Structure (Strcuture)
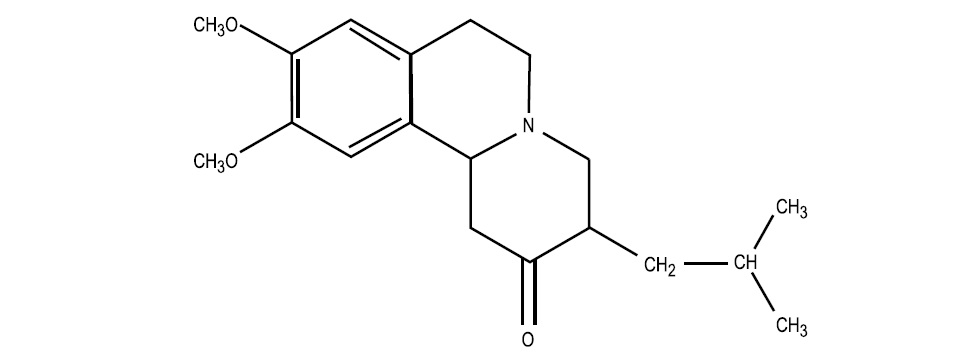
Structure (Strcuture)
Chemical structure of tetrabenazine, showing its molecular components including methoxy groups and a ketone functional group within a complex ring arrangement.*
FDA Label Image

Figure 1 (Fig 1)

Figure 1 (Fig 1)
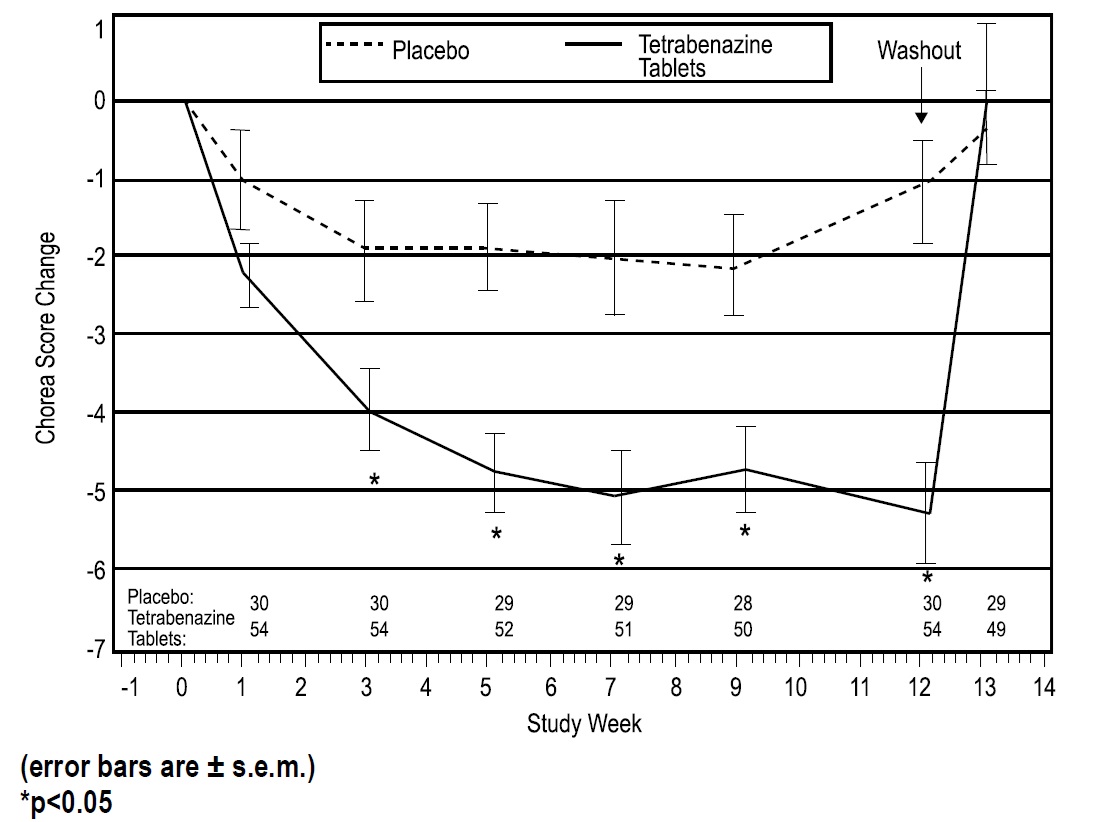
A line graph showing change in chorea score over study weeks comparing tetrabenazine tablets and placebo. The x-axis represents study weeks from -1 to 14, and the y-axis shows chorea score change ranging from -7 to 1. The graph includes error bars and annotated sample sizes for placebo and tetrabenazine groups at each time point. Treatment with tetrabenazine tablets shows a greater reduction in chorea scores over the study period compared to placebo, with markers indicating statistical significance at multiple weeks.*
FDA Label Image

Figure 2 (Fig 2)

Figure 2 (Fig 2)
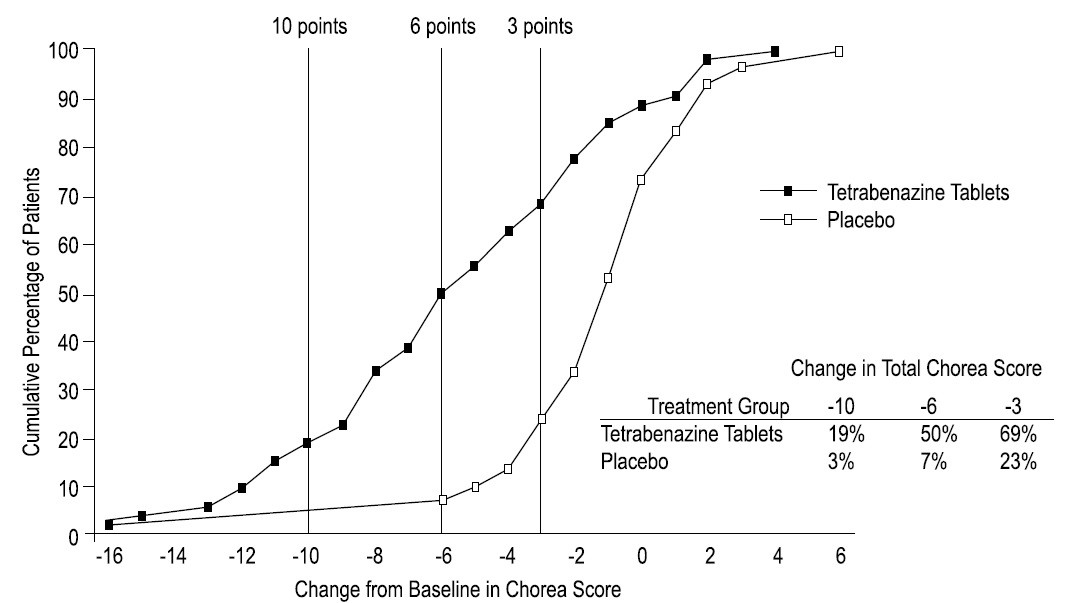
A cumulative percentage of patients graph depicting changes from baseline in chorea score for Tetrabenazine Tablets versus Placebo. The x-axis shows change in chorea score ranging from -16 to 6, while the y-axis shows cumulative percentage of patients from 0 to 100%. The graph includes vertical lines marking 10, 6, and 3 points of change, with Tetrabenazine Tablets data represented by filled squares and Placebo by open squares. A small table shows the percentage of patients experiencing decreases of 10, 6, and 3 points for both groups.*
FDA Label Image
FDA Label Image
FDA Label Image

Label 12.5 (12.5 112)

FDA Label Image

Label 25 (25 112)

* About these descriptions: Image descriptions on this page are generated by automated AI analysis of the product label images from the manufacturer's FDA label submission (SPL). They are provided for reference only and may contain errors or omissions. Always rely on the printed label itself and the official FDA labeling, and consult a pharmacist or healthcare professional with any questions about this product.