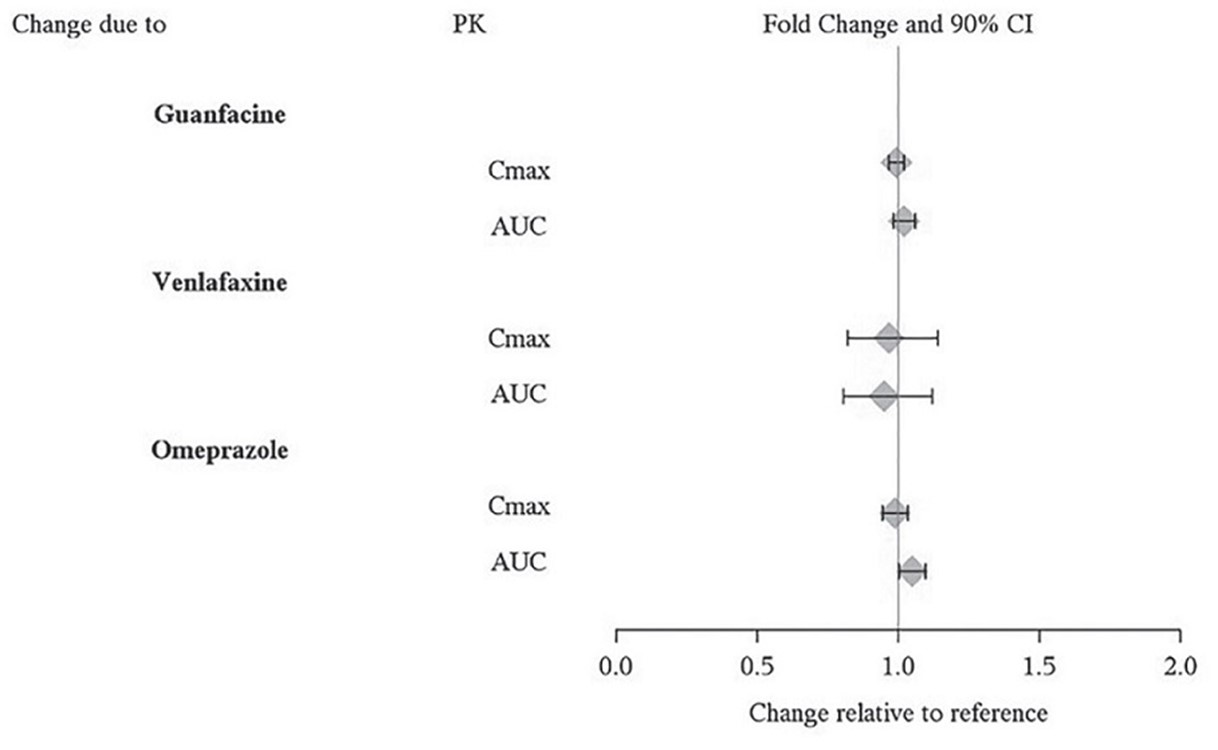
Figure-1 (Figure 1)
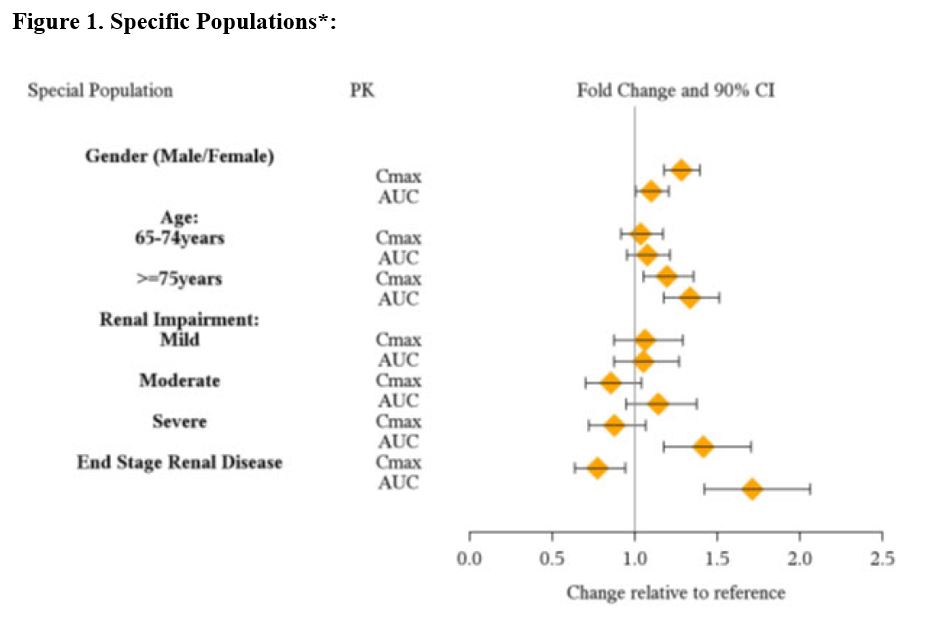
This is a table showing specific populations and their PK fold change along with 90% confidence intervals for a specific medication. The populations considered include different age groups and levels of renal impairment. The table outlines the fold change in Cmax (maximum concentration) and AUC (area under the curve) relative to a reference group.*