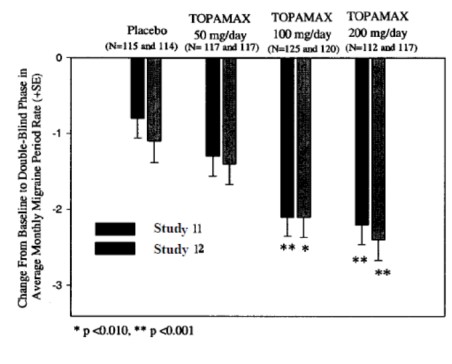
Figure1 (Figure 1)

This text appears to be a chart displaying cumulative rates for time to the first seizure. The chart shows rates at different time intervals, ranging from 0 to 500 days. The rates are represented by percentage values, ranging from 0.00% to 5.0%, which are likely associated with different dosages of a medication called Topamax. The dosages mentioned include 50 mg/day (N=234) and 400 mg/day (N=236). A significant p-value of 0.0002 suggests a statistically significant difference between the two dosages in terms of their effectiveness in preventing seizures.*