Pregabalin Capsule
Product Images NDC 25000-185

View Photos of Packaging, Regulatory Labels, and Product Appearance

Product Visual Gallery

This gallery contains 30 technical images submitted to the FDA as part of the official labeling for Pregabalin (NDC 25000-185). Unlike standard consumer photos, these assets often include clinical data figures, molecular chemical structures, and official manufacturer packaging layouts.

As provided by Marksans Pharma Limited, these visuals offer a comprehensive scientific overview of the product's physical and chemical identity, aiding pharmacists and researchers in product verification and study.

FDA Label Image

Sec11descp (11 Desc)
Sec11descp (11 Desc)
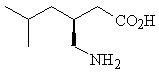
Chemical structure diagram of pregabalin, showing its molecular formula with carboxyl (CO2H) and amine (NH2) functional groups and side chains.*
FDA Label Image

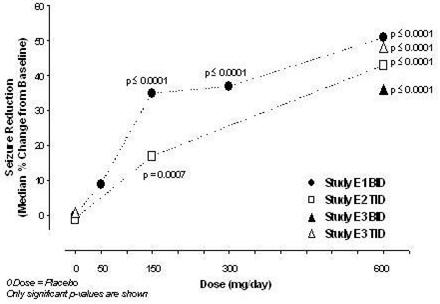
Fig 7 (Fig 7)

Fig 7 (Fig 7)
A line graph depicting median percent change from baseline in seizure reduction versus dose (mg/day) in studies labeled E1 BID, E2 TID, E3 BID, and E3 TID. The graph shows increasing seizure reduction with increasing dose, with statistical significance indicated (p values ≤ 0.0001 and one at 0.0007) for various dose points. The x-axis represents dose in mg/day, and the y-axis represents median seizure reduction percentage.*
FDA Label Image

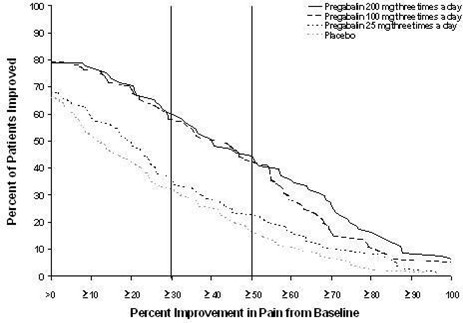
Fig1 (Fig1)

Fig1 (Fig1)
A line graph showing percent improvement in pain from baseline on the x-axis and percent of patients improved on the y-axis. The graph compares four groups: Pregabalin 200 mg three times a day, Pregabalin 100 mg three times a day, Pregabalin 25 mg three times a day, and placebo, illustrating patient response rates across different improvement thresholds.*
FDA Label Image

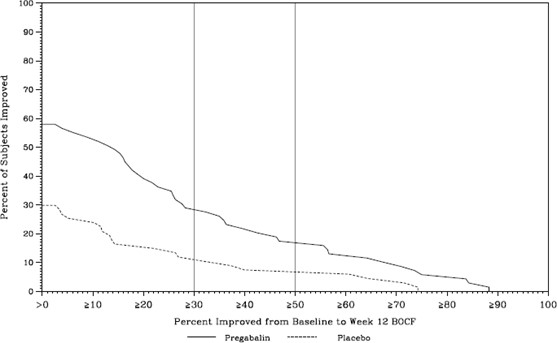
Fig11 (Fig11)

Fig11 (Fig11)
A line graph comparing the percentage of subjects improved from baseline to week 12 BOCF between Pregabalin and placebo groups. The horizontal axis shows percent improvement, and the vertical axis shows the percent of subjects improved, with Pregabalin represented by a solid line and placebo by a dashed line.*
FDA Label Image

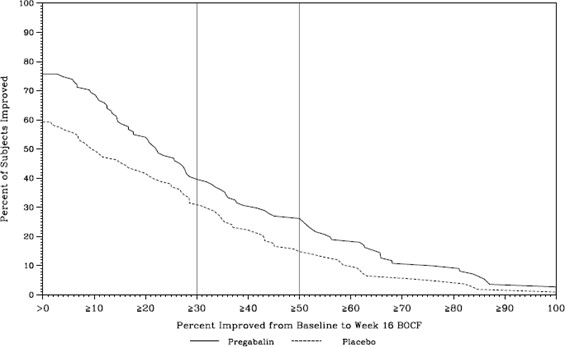
Fig12 (Fig12)

Fig12 (Fig12)
A line graph comparing the percent of subjects improved from baseline to Week 16 BOCF for Pregabalin versus Placebo. The y-axis shows the percent of subjects improved, and the x-axis indicates the percent improvement. The graph features two lines: a solid line for Pregabalin and a dashed line for Placebo, illustrating greater improvement with Pregabalin over Placebo across varying improvement percentages.*
FDA Label Image

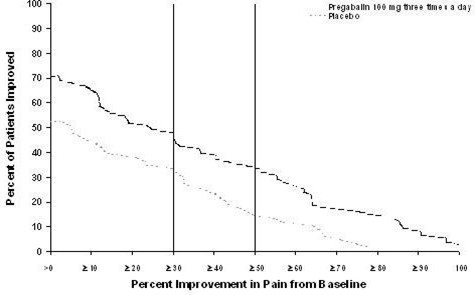
Fig2 (Fig2)

Fig2 (Fig2)
A line graph depicting the percentage of patients improved versus percent improvement in pain from baseline. It compares Pregabalin 100 mg three times a day and placebo, showing a higher percentage of patients improving with Pregabalin across various levels of pain improvement.*
FDA Label Image

Fig3 (Fig3)

Fig3 (Fig3)
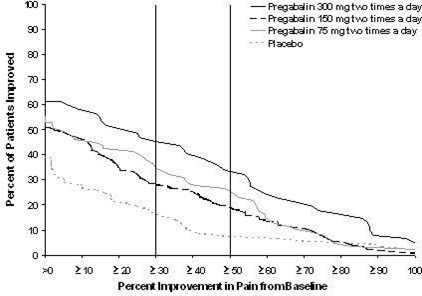
A line graph comparing the percentage of patients improved versus percent improvement in pain from baseline for Pregabalin capsules at 75 mg, 150 mg, and 300 mg doses taken twice a day, versus placebo. The graph shows improvement trends over a range of pain relief percentages.*
FDA Label Image

Fig4 (Fig4)

Fig4 (Fig4)
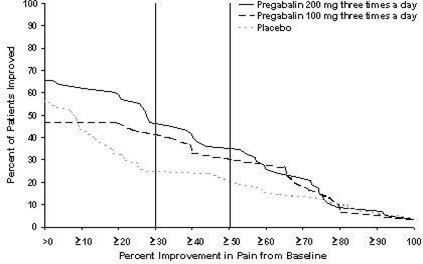
A line graph depicting percent improvement in pain from baseline on the x-axis and percent of patients improved on the y-axis for Pregabalin oral capsules at 100 mg and 200 mg thrice daily doses compared to placebo. The chart shows the relative effectiveness of these doses in improving patient pain.*
FDA Label Image

Fig5 (Fig5)

Fig5 (Fig5)
A line graph depicting the percent of patients improved relative to the percent improvement in pain from baseline. The graph compares Pregabalin 100 mg three times a day, Pregabalin 50 mg three times a day, and placebo, showing trends of patient improvement across varying levels of pain improvement.*
FDA Label Image

Fig8 (Fig8)

Fig8 (Fig8)
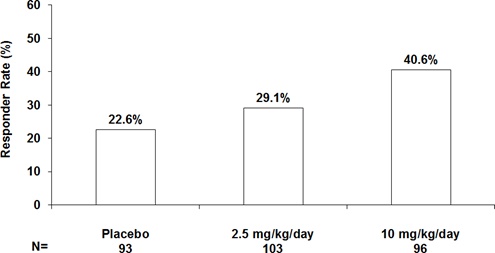
A vertical bar chart showing responder rates (%) for three groups: Placebo (22.6%), 2.5 mg/kg/day dose of Pregabalin (29.1%), and 10 mg/kg/day dose of Pregabalin (40.6%). The x-axis lists treatment groups and the y-axis shows responder rate percentage.*
FDA Label Image

Fig10 (Figure 10)

Fig10 (Figure 10)
A line graph showing the estimated percentage of subjects without LTR (likely loss to retention) over 180 days. Two groups are compared: Pregabalin (solid line) and Placebo (dashed line). The graph illustrates that subjects in the Pregabalin group maintain a higher estimated percentage without LTR throughout the period compared to the Placebo group.*
FDA Label Image

Fig9 (Figure 9)

Fig9 (Figure 9)
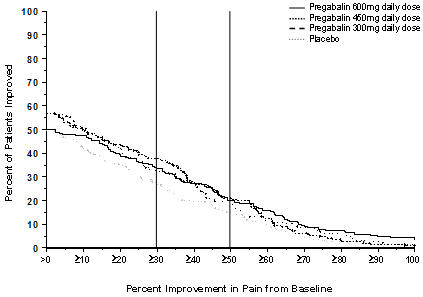
A line graph showing the percent of patients improved versus percent improvement in pain from baseline. The graph compares four groups: Pregabalin 600 mg daily dose, Pregabalin 450 mg daily dose, Pregabalin 300 mg daily dose, and Placebo. The x-axis represents percent improvement in pain from baseline, and the y-axis represents percent of patients improved.*
FDA Label Image

Image6 (Image6)

Image6 (Image6)
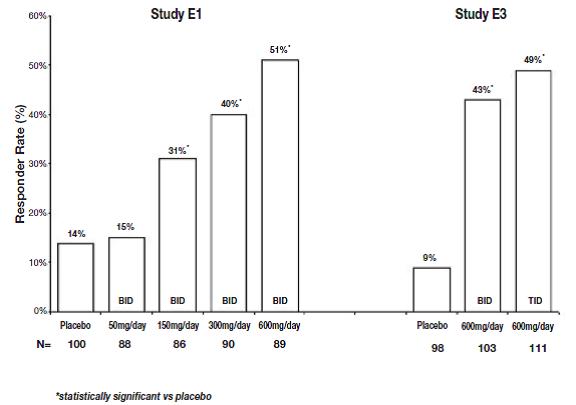
Bar chart comparing responder rates (%) in Study E1 and Study E3 for various doses of Pregabalin versus placebo. The x-axis shows different dosing regimens including placebo and multiple Pregabalin daily doses, while the y-axis shows responder rates as a percentage. The chart includes sample sizes for each group and indicates statistical significance versus placebo.*
FDA Label Image

Prega-100mg-90s (Prega 100mg 90s Label)

Prega-100mg-90s (Prega 100mg 90s Label)
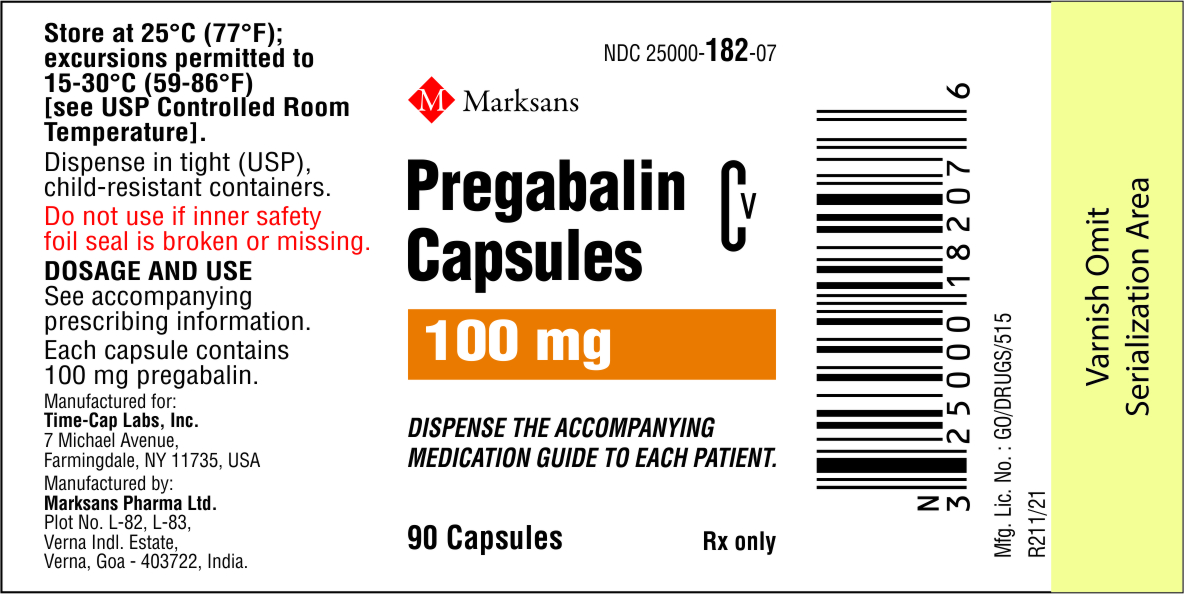
Label for Pregabalin Capsules 100 mg by Marksans Pharma Limited, packaged in a container of 90 capsules. The label includes storage instructions, dosage warnings, and manufacturing details listing Time-Cap Labs, Inc. and Marksans Pharma Ltd. The barcode and NDC 25000-182-07 are shown, along with a note to dispense the medication guide to patients.*
FDA Label Image

Prega-150mg-90s (Prega 150mg 90s Label)

Prega-150mg-90s (Prega 150mg 90s Label)
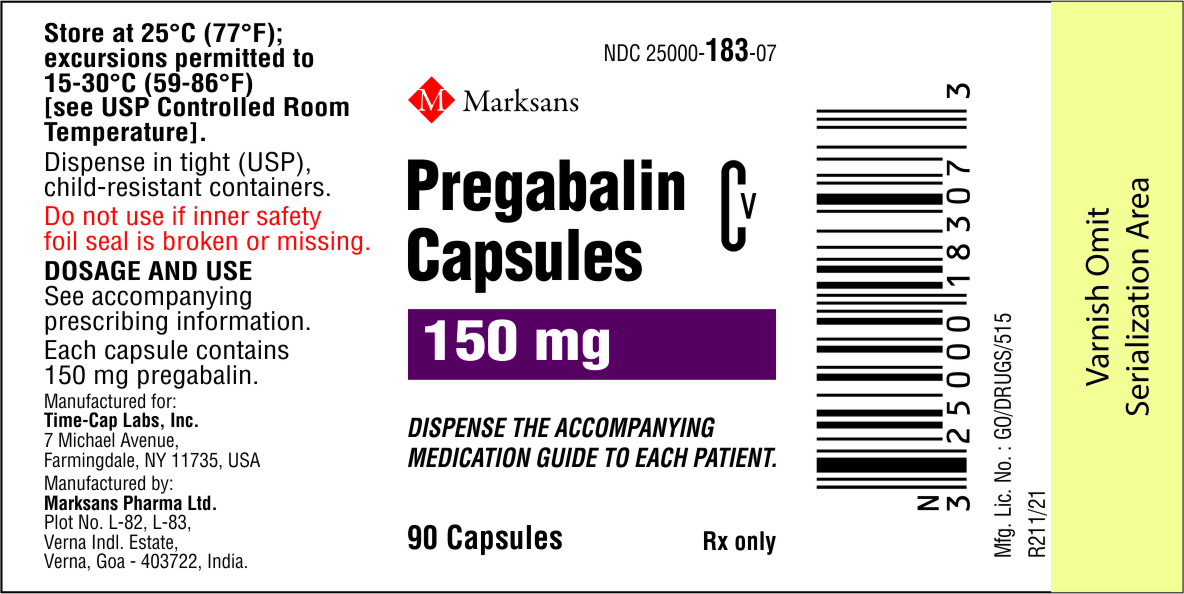
Pregabalin Capsules 150 mg packaging label from Marksans Pharma Limited. The label indicates each capsule contains 150 mg of pregabalin and the package contains 90 capsules. It includes storage instructions, a barcode, and manufacturing details for Marksans Pharma Ltd. and Time-Cap Labs, Inc. The label also advises dispensing the accompanying medication guide to each patient.*
FDA Label Image

Prega-200mg-90s (Prega 200mg 90s Label)

Prega-200mg-90s (Prega 200mg 90s Label)
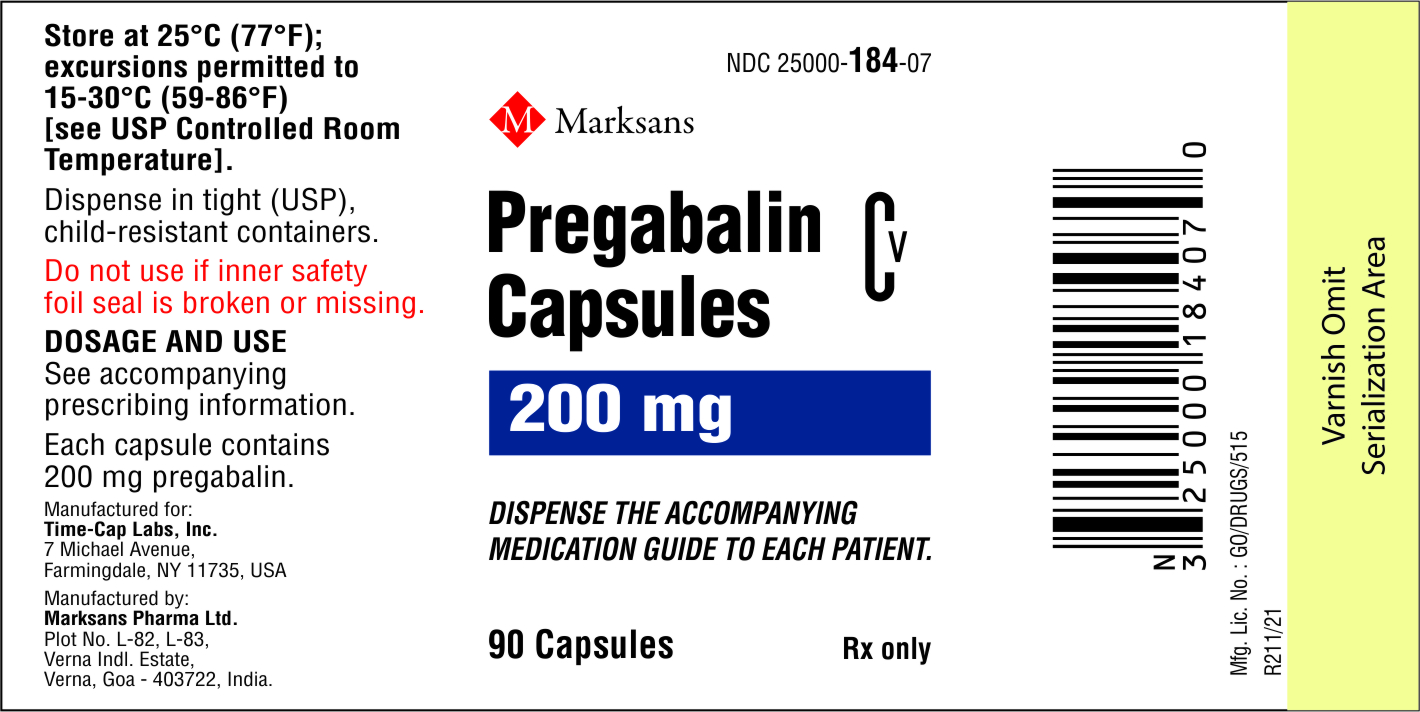
Pregabalin Capsules 200 mg oral capsules packaging label. The label indicates the product contains 90 capsules and is for prescription use only (Rx only). Manufactured by Marksans Pharma Ltd. and labeled for Time-Cap Labs, Inc. It includes storage instructions and a barcode.*
FDA Label Image

Prega-225mg-90s (Prega 225mg 90s Label)

Prega-225mg-90s (Prega 225mg 90s Label)
Label for Pregabalin Capsules 225 mg by Marksans Pharma Ltd. The label indicates 90 capsules per container, Rx only. Storage instructions advise 25°C with permitted excursions. Manufacturer details and barcode are visible. The label includes a warning about the safety foil seal.*
FDA Label Image

Prega-25mg-90s (Prega 25mg 90s Label)

Prega-25mg-90s (Prega 25mg 90s Label)
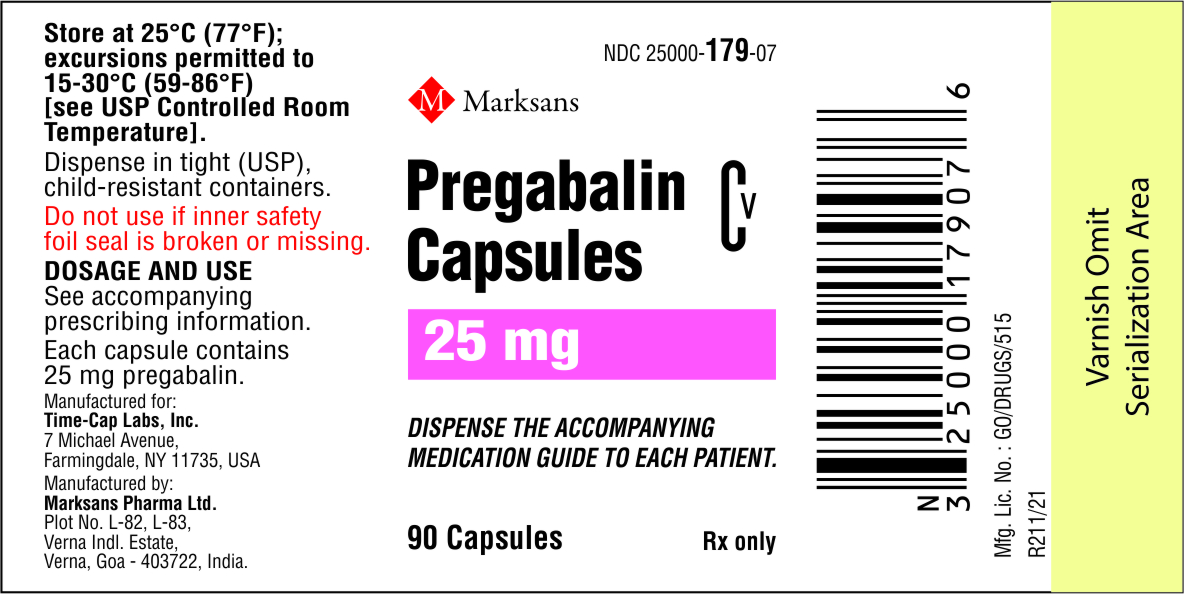
Pregabalin Capsules 25 mg oral capsule label from Marksans Pharma Limited. The label indicates a package containing 90 capsules with instructions including storage at 25°C and warnings about the inner safety foil seal. Manufacturer and distributor details are visible, along with the National Drug Code (NDC) 25000-179-07.*
FDA Label Image

Prega-300mg-90s (Prega 300mg 90s Label)

Prega-300mg-90s (Prega 300mg 90s Label)
Pregabalin 300 mg capsules label showing product name, strength, and dosage form. The label indicates that each capsule contains 300 mg pregabalin, with a package size of 90 capsules. It is labeled for prescription use (Rx only). Manufactured by Marksans Pharma Ltd. for Time-Cap Labs, Inc., with storage instructions and safety warnings also visible.*
FDA Label Image

Prega-50mg-90s (Prega 50mg 90s Label)

Prega-50mg-90s (Prega 50mg 90s Label)
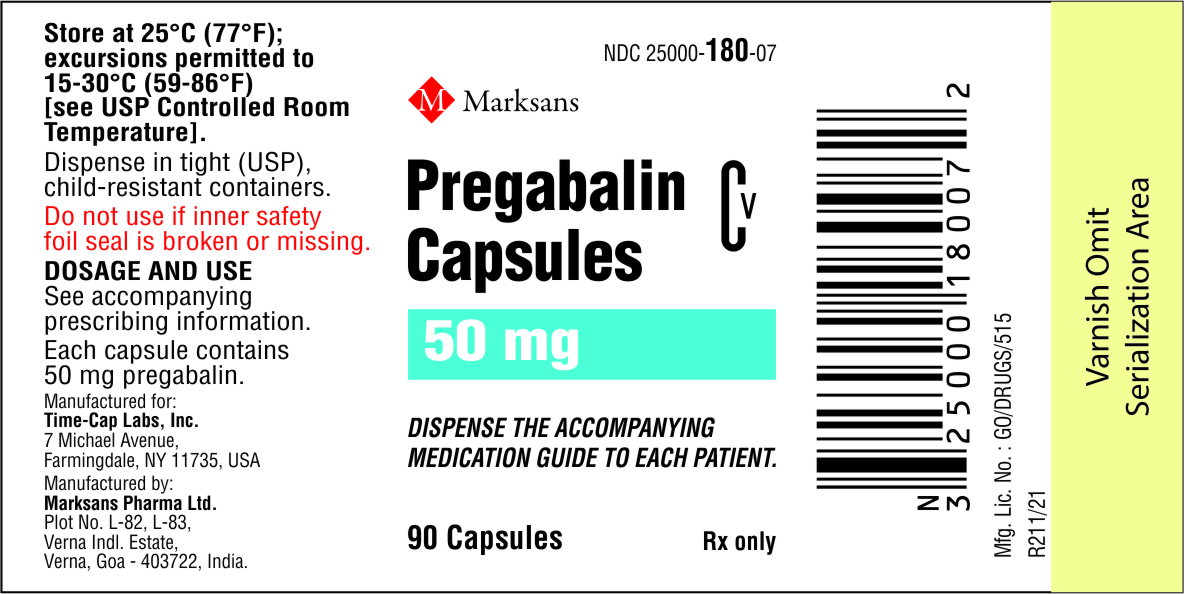
Label for Pregabalin Capsules 50 mg by Marksans Pharma Limited. The label indicates the dosage strength as 50 mg per capsule and states the package contains 90 capsules. It includes storage instructions, manufacturer information, a barcode, and a note to dispense the accompanying medication guide to each patient. The label also shows the NDC number 25000-180-07.*
FDA Label Image

Prega-75mg-90s (Prega 75mg 90s Label)

Prega-75mg-90s (Prega 75mg 90s Label)
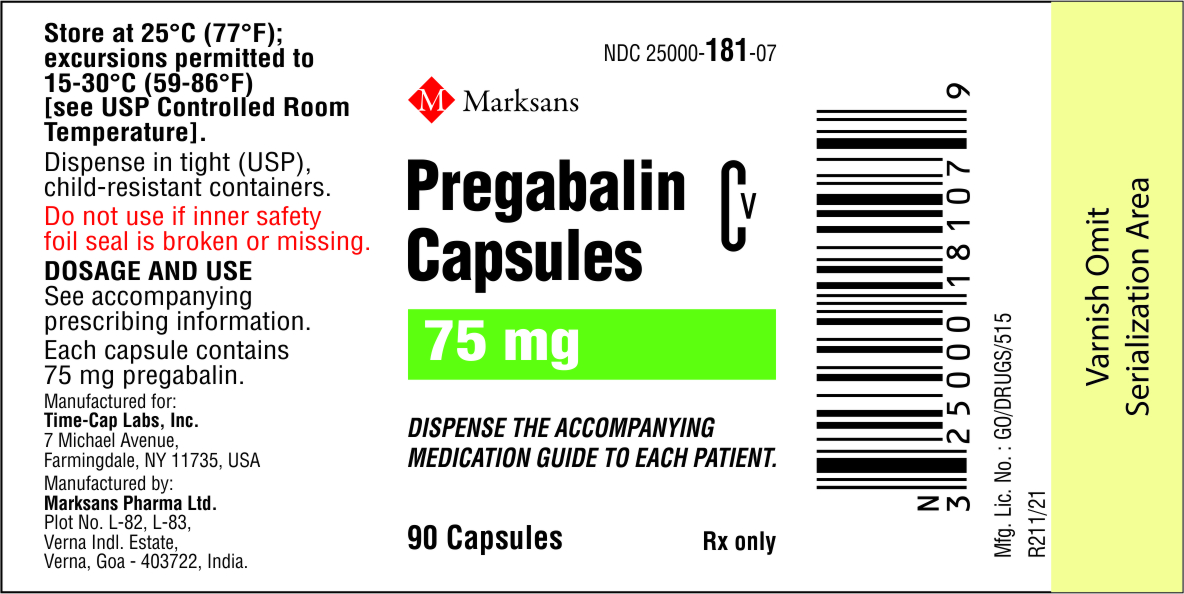
Label for Pregabalin Capsules 75 mg by Marksans Pharma Limited. The label indicates a 90-capsule package, with a prescription-only designation. It includes storage instructions, a barcode, and manufacturing details for Marksans Pharma Ltd., India, and Time-Cap Labs, Inc., USA. The label also cautions against use if the inner safety seal is broken or missing.*
FDA Label Image

Sec27 (Sec27)

Sec27 (Sec27)
A mathematical formula calculating creatinine clearance (CLCr) based on age, weight, serum creatinine, and a correction factor for female patients. The formula shows CLCr as a function of age in years, weight in kilograms, serum creatinine in mg/dL, and multiplies by 0.85 for female patients.*
FDA Label Image

Tab10 (Table 10)

Tab10 (Table 10)
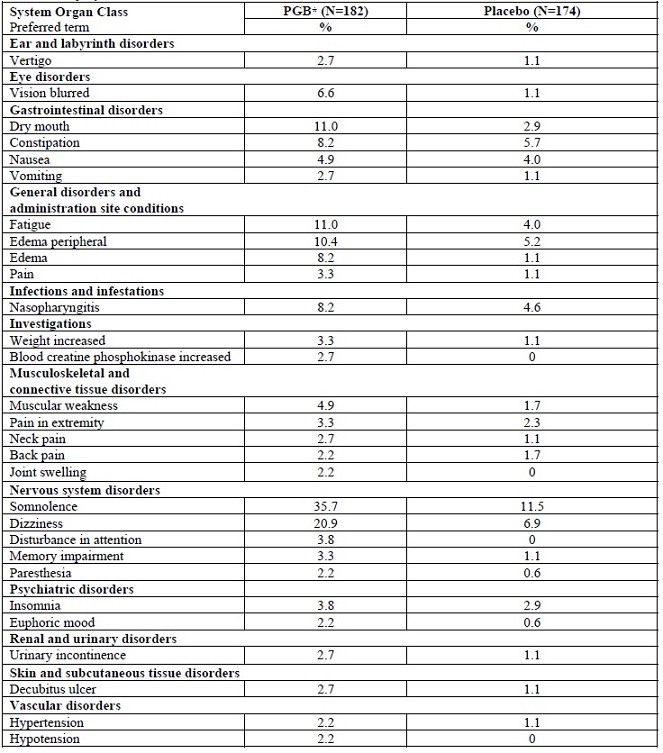
Table listing adverse event frequencies by system organ class for Pregabalin (PGB) and placebo groups. It compares percentage incidence of various disorders such as ear, eye, gastrointestinal, nervous system, psychiatric, and others for Pregabalin (N=182) and placebo (N=174) subjects.*
FDA Label Image

Tab11 (Table 11)

Tab11 (Table 11)
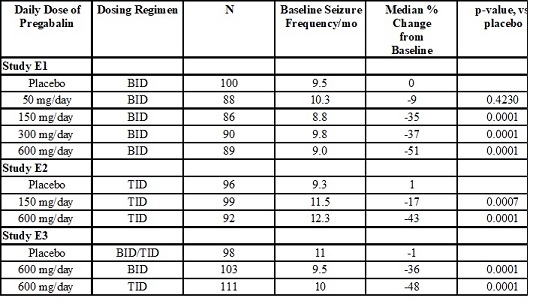
A data table presenting clinical study results on daily doses of Pregabalin, showing dosing regimens, sample sizes, baseline seizure frequency per month, median percentage changes from baseline, and p-values versus placebo across three studies identified as E1, E2, and E3.*
FDA Label Image

Tab14 (Table 14)

Tab14 (Table 14)
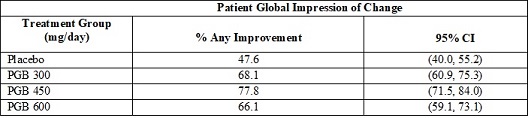
A data table titled 'Patient Global Impression of Change' showing treatment groups by mg/day and their corresponding percentage of any improvement with 95% confidence intervals. Treatment groups include placebo, PGB 300, PGB 450, and PGB 600, with improvement percentages ranging from 47.6% to 77.8%.*
FDA Label Image

Table 4 (Table 4)

Table 4 (Table 4)
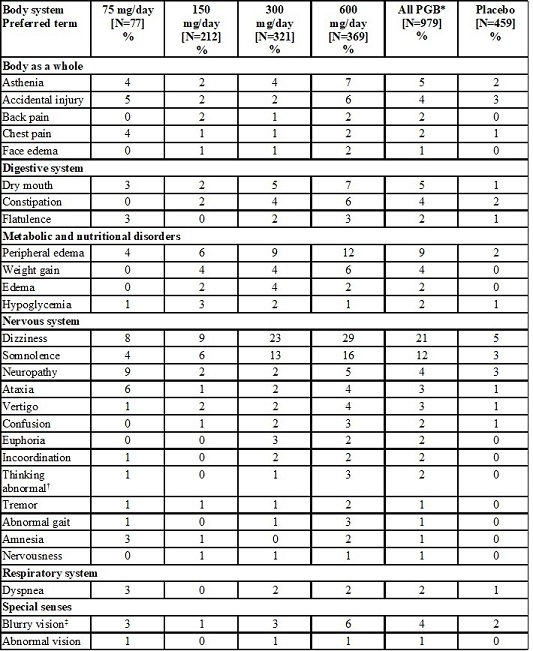
A data table showing the percentage of patients experiencing various preferred terms for adverse effects grouped by body system, across different daily doses of Pregabalin capsules (75 mg to 600 mg) including a placebo group. Categories include body as a whole, digestive system, metabolic and nutritional disorders, nervous system, respiratory system, and special senses, with detailed symptoms such as asthenia, dizziness, peripheral edema, and blurred vision, among others.*
FDA Label Image

Tab5 (Table 5)

Tab5 (Table 5)
A data table detailing adverse event percentages by body system for Pregabalin capsules at various dosages (75 mg/d, 150 mg/d, 300 mg/d, 600 mg/d), including placebo and overall Pregabalin groups. The table covers infections, nervous system effects, metabolic, musculoskeletal, respiratory, special senses, and urogenital symptoms among others.*
FDA Label Image

Tab6 (Table 6)

Tab6 (Table 6)
Data table comparing the percentage incidence of various body system-related adverse events across different Pregabalin dosages (150 mg/day, 300 mg/day, 600 mg/day) and placebo groups. The table is grouped by body systems including Body as a Whole, Digestive System, Metabolic and Nutritional Disorders, Nervous System, and Special Senses, listing conditions such as accidental injury, dizziness, somnolence, and blurred vision.*
FDA Label Image

Tab9 (Table 9)

Tab9 (Table 9)
A data table detailing the incidence percentages of various adverse events across multiple dosages of Pregabalin capsules (150 mg to 600 mg daily), including comparisons with placebo. The table categorizes events by system organ class such as Ear and Labyrinth Disorders, Gastrointestinal Disorders, Nervous System Disorders, and Psychiatric Disorders, reporting frequencies for conditions like dizziness, somnolence, dry mouth, and fatigue.*
FDA Label Image

Table12 (Table12)

Table12 (Table12)
A data table presenting daily doses of Pregabalin with columns for sample size (N), median baseline seizure frequency over 28 days, median percentage change from baseline, percentage difference relative to placebo, and p-values comparing dosages to placebo. It compares placebo, 2.5 mg/kg/day, and 10 mg/kg/day dosages.*

* About these descriptions: Image descriptions on this page are generated by automated AI analysis of the product label images from the manufacturer's FDA label submission (SPL). They are provided for reference only and may contain errors or omissions. Always rely on the printed label itself and the official FDA labeling, and consult a pharmacist or healthcare professional with any questions about this product.