Tadalafil Tablet
Product Images NDC 27241-114

13 FDA label images from Ajanta Pharma Usa Inc. · Packaging, Regulatory Labels, and Product Appearance

Product Visual Gallery

This gallery contains 13 technical images submitted to the FDA as part of the official labeling for Tadalafil (NDC 27241-114). Unlike standard consumer photos, these assets often include clinical data figures, molecular chemical structures, and official manufacturer packaging layouts.

As provided by Ajanta Pharma Usa Inc., these visuals offer a comprehensive scientific overview of the product's physical and chemical identity, aiding pharmacists and researchers in product verification and study.

FDA Label Image

Structure (Tadalafil Structure)

Structure (Tadalafil Structure)
Chemical structure of Tadalafil. The image shows a detailed molecular diagram depicting the arrangement of atoms and bonds consistent with the tadalafil molecule.*
FDA Label Image

Figure1 (Tadalafil Figure1)

Figure1 (Tadalafil Figure1)
Four line graphs depicting blood pressure changes over time comparing Tadalafil and placebo. The graphs show differences in standing systolic, standing diastolic, supine systolic, and supine diastolic blood pressure measured in mmHg from 0 to 96 hours after dosing.*
FDA Label Image

Figure2 (Tadalafil Figure2)

Figure2 (Tadalafil Figure2)
Two line graphs showing standing and supine systolic blood pressure (mmHg) versus time post-dose (hours). The top graph compares Tadalafil 20 mg with doxazosin 8 mg to placebo with doxazosin 8 mg in standing systolic blood pressure. The bottom graph shows the same comparison for supine systolic blood pressure over 24 hours.*
FDA Label Image

Figure3 (Tadalafil Figure3)

Figure3 (Tadalafil Figure3)
A line graph depicting systolic blood pressure (mmHg) changes over time (hours) after administration of tadalafil or placebo combined with doxazosin. The x-axis represents time post-dose up to 12 hours, and the y-axis shows systolic blood pressure changes from -20 to +20 mmHg. The graph compares 20 mg tadalafil versus placebo at two different times with 8 mg doxazosin coadministration.*
FDA Label Image

Figure4 (Tadalafil Figure4)

Figure4 (Tadalafil Figure4)
A line graph showing plasma tadalafil concentration (μg/L) over time (hours) for three dosing regimens: single 20-mg tadalafil dose, single 5-mg tadalafil dose, and once-daily 5-mg tadalafil following 5 consecutive days of administration. Concentrations peak early and decline over time, with detailed error bars indicating variability.*
FDA Label Image

Figure5 (Tadalafil Figure5)

Figure5 (Tadalafil Figure5)
A line graph showing the change from baseline in IPSS total score over a 12-week treatment period comparing Tadalafil 5 mg with placebo. The graph shows Tadalafil 5 mg results in a greater decrease in score over time, with statistical significance indicated (p<0.01).*
FDA Label Image

Figure6 (Tadalafil Figure6)

Figure6 (Tadalafil Figure6)
A line graph comparing the change from baseline in IPSS Total Score over 12 weeks of treatment with Tadalafil 5 mg versus placebo. The x-axis represents treatment duration in weeks, and the y-axis shows the change from baseline. Data points indicate significant improvement with Tadalafil compared to placebo (*p<0.01).*
FDA Label Image

Figure7 (Tadalafil Figure7)

Figure7 (Tadalafil Figure7)
A line graph depicting the least-squares mean change from baseline over 26 weeks of therapy. It compares treatment with Tadalafil/Finasteride versus Placebo/Finasteride, showing a greater reduction for Tadalafil/Finasteride at 4, 12, and 26 weeks. Statistical significance is indicated with p-values (a p<0.001, b p<0.05).*
FDA Label Image

Figure8 (Tadalafil Fig8)

Figure8 (Tadalafil Fig8)
A line chart comparing changes from baseline in IPSS total score over 12 weeks of treatment with Tadalafil 5 mg tablets versus placebo. The x-axis shows treatment duration in weeks, and the y-axis shows change from baseline in IPSS score. The Tadalafil group shows a greater decrease in score over time compared to placebo, with statistical significance noted at 12 weeks (p<0.01).*
FDA Label Image

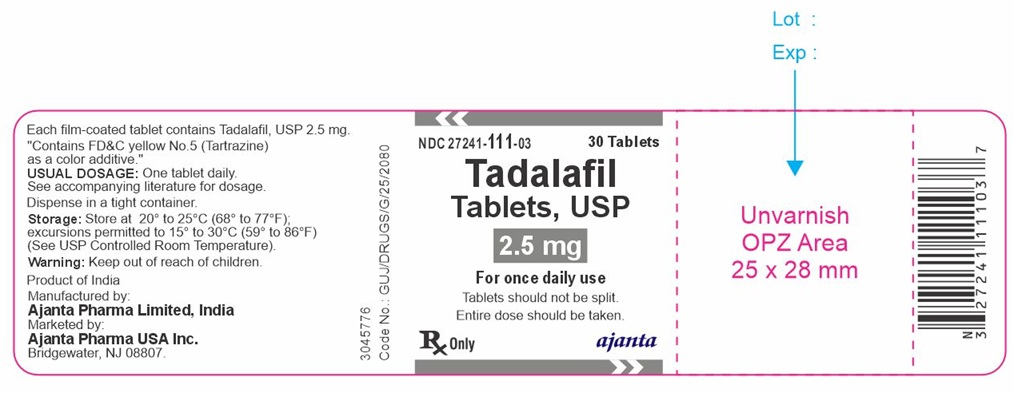
2.5mg (Tadalafll 2 5mg)

2.5mg (Tadalafll 2 5mg)
Label for Tadalafil Tablets USP 2.5 mg oral tablets, containing 30 tablets per package. The label includes dosage information, storage instructions, and manufacturer details: Ajanta Pharma Limited, India, and marketing by Ajanta Pharma USA Inc., Bridgewater, NJ. It also notes the color additive Tartrazine and provides directions for use and warnings.*
FDA Label Image

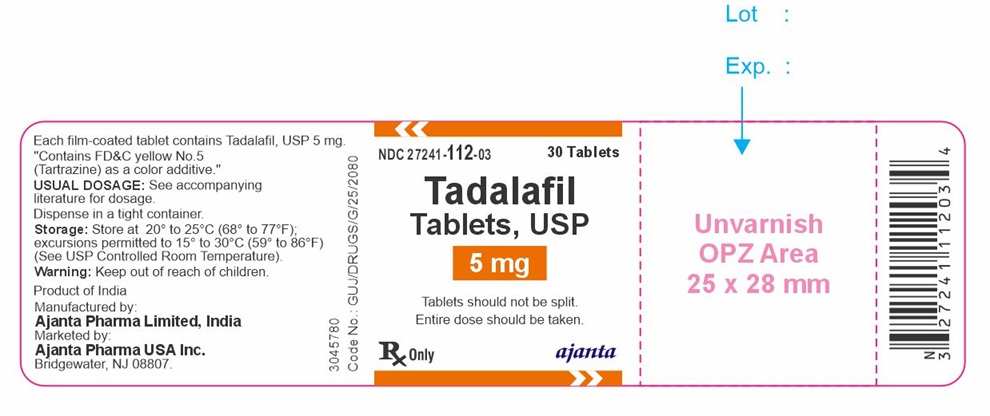
5mg (Tadalafll 5mg)

5mg (Tadalafll 5mg)
Label for Tadalafil Tablets USP 5 mg, containing 30 tablets by Ajanta Pharma USA Inc. The label includes dosage and storage instructions, a barcode, and identifies the manufacturer as Ajanta Pharma Limited, India. The label also notes the color additive FD&C yellow No. 5 (Tartrazine) and includes an unvarnished printing area.*
FDA Label Image

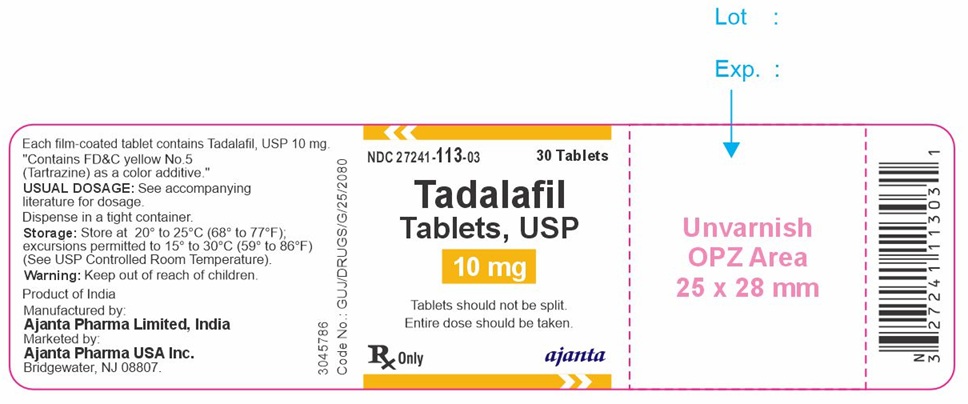
10mg (Tadalafll 10mg)

10mg (Tadalafll 10mg)
Label for Tadalafil Tablets, USP 10 mg oral tablets by Ajanta Pharma USA Inc. The package contains 30 film-coated tablets. Storage instructions specify 20 to 25°C with permitted excursions. Manufactured by Ajanta Pharma Limited, India, marketed by Ajanta Pharma USA Inc. Additional label data includes a barcode and blank lot and expiration fields.*
FDA Label Image

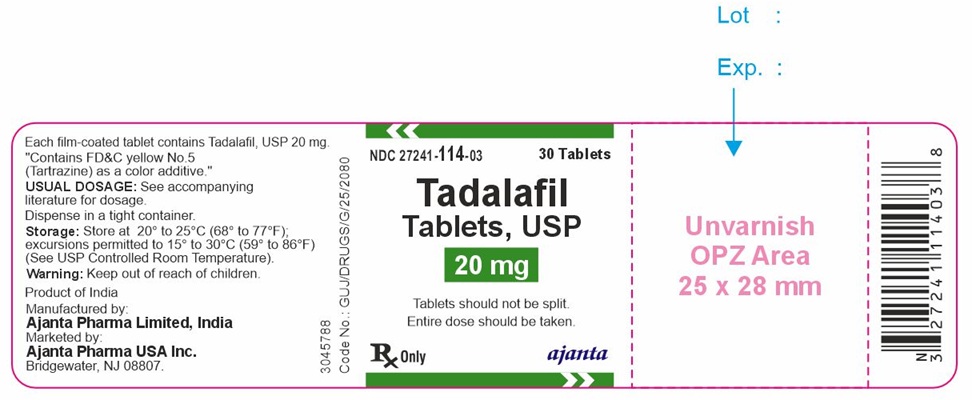
20mg (Tadalafll 20mg)

20mg (Tadalafll 20mg)
Label for Tadalafil Tablets, USP 20 mg by Ajanta Pharma USA Inc. The film-coated tablets come in a bottle of 30 count. Storage instructions specify 20° to 25°C with excursions allowed to 15° to 30°C. The label includes dosage and warning information and indicates the product is manufactured in India.*

* About these descriptions: Image descriptions on this page are generated by automated AI analysis of the product label images from the manufacturer's FDA label submission (SPL). They are provided for reference only and may contain errors or omissions. Always rely on the printed label itself and the official FDA labeling, and consult a pharmacist or healthcare professional with any questions about this product.