Irbesartan And Hydrochlorothiazide Tablet, Film Coated
Product Images NDC 29300-216

11 FDA label images from Unichem Pharmaceuticals (usa), Inc. · Packaging, Regulatory Labels, and Product Appearance

Product Visual Gallery

This gallery contains 11 technical images submitted to the FDA as part of the official labeling for Irbesartan And Hydrochlorothiazide (NDC 29300-216). Unlike standard consumer photos, these assets often include clinical data figures, molecular chemical structures, and official manufacturer packaging layouts.

As provided by Unichem Pharmaceuticals (usa), Inc., these visuals offer a comprehensive scientific overview of the product's physical and chemical identity, aiding pharmacists and researchers in product verification and study.

FDA Label Image

33edeed5 8a7f 4753 8729 84714238a5c5 01
33edeed5 8a7f 4753 8729 84714238a5c5 01
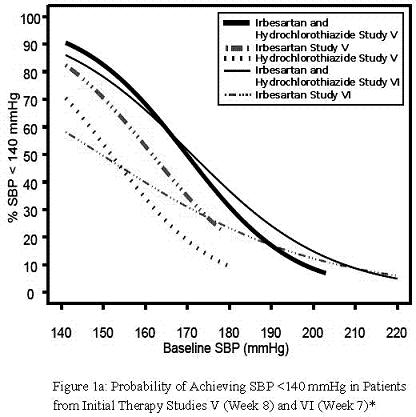
A line graph depicting the probability of achieving systolic blood pressure (SBP) less than 140 mmHg in patients from initial therapy studies V and VI at Week 8 and Week 7, respectively. The x-axis shows baseline SBP (mmHg) ranging from 140 to 220, and the y-axis shows the percentage of patients achieving SBP <140 mmHg ranging from 0 to 100%. Multiple lines represent different treatments including Irbesartan and Hydrochlorothiazide Study V, Irbesartan Study V, Hydrochlorothiazide Study V, Irbesartan and Hydrochlorothiazide Study VI, and Irbesartan Study VI.*
FDA Label Image

33edeed5 8a7f 4753 8729 84714238a5c5 02

33edeed5 8a7f 4753 8729 84714238a5c5 02
A line graph showing the probability of achieving systolic blood pressure (SBP) below 130 mmHg in patients, plotted against baseline SBP values ranging from 140 to 220 mmHg. The graph includes multiple study data series labeled as Irbesartan and Hydrochlorothiazide Study V and VI, with different line styles representing each study and treatment. The vertical axis represents the percentage achieving target SBP, while the horizontal axis shows baseline SBP in mmHg.*
FDA Label Image

33edeed5 8a7f 4753 8729 84714238a5c5 03

33edeed5 8a7f 4753 8729 84714238a5c5 03
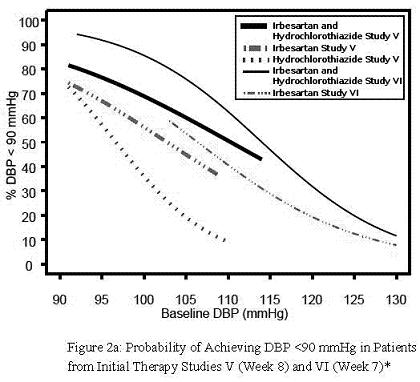
A line chart showing the probability of achieving diastolic blood pressure (DBP) below 90 mmHg relative to baseline DBP values. The chart compares results from Irbesartan and Hydrochlorothiazide combination therapy, Irbesartan alone, and Hydrochlorothiazide alone in two studies, Study V and Study VI, over weeks 7 and 8 of initial therapy.*
FDA Label Image

33edeed5 8a7f 4753 8729 84714238a5c5 04

33edeed5 8a7f 4753 8729 84714238a5c5 04
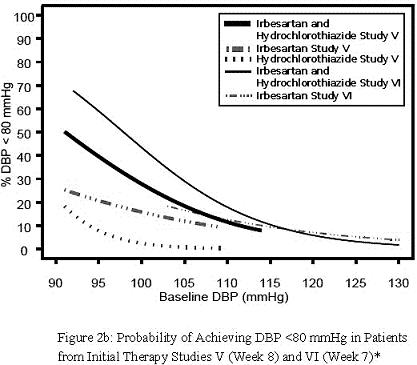
A line graph showing the probability of achieving diastolic blood pressure (DBP) under 80 mmHg against baseline DBP (mmHg). The graph includes multiple study groups: Irbesartan and Hydrochlorothiazide Study V, Irbesartan Study V, Hydrochlorothiazide Study V, Irbesartan and Hydrochlorothiazide Study VI, and Irbesartan Study VI, with data lines depicting different response rates across baseline DBP values.*
FDA Label Image

33edeed5 8a7f 4753 8729 84714238a5c5 05

33edeed5 8a7f 4753 8729 84714238a5c5 05
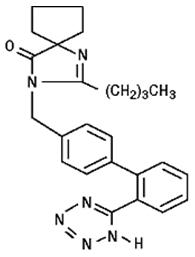
Chemical structure diagram of Irbesartan, part of the combination drug Irbesartan and Hydrochlorothiazide.*
FDA Label Image

33edeed5 8a7f 4753 8729 84714238a5c5 06

33edeed5 8a7f 4753 8729 84714238a5c5 06
Chemical structure diagram showing the molecular structure of Irbesartan, one of the active ingredients in Irbesartan and Hydrochlorothiazide tablets.*
FDA Label Image

33edeed5 8a7f 4753 8729 84714238a5c5 07

33edeed5 8a7f 4753 8729 84714238a5c5 07
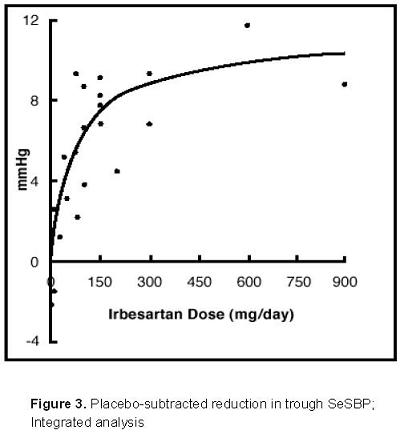
A scatter plot with a fitted curve depicting the relationship between Irbesartan dose (mg/day) on the x-axis and reduction in trough SeSBP (mmHg) on the y-axis, showing a dose-dependent increase in blood pressure reduction up to approximately 900 mg/day.*
FDA Label Image

33edeed5 8a7f 4753 8729 84714238a5c5 08

33edeed5 8a7f 4753 8729 84714238a5c5 08
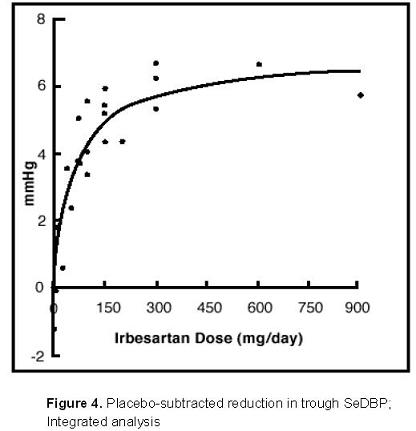
A scatter plot with a fitted curve showing the relationship between Irbesartan dose (mg/day) on the x-axis and placebo-subtracted reduction in trough SeDBP (mmHg) on the y-axis. The graph illustrates increasing blood pressure reduction with higher doses of Irbesartan up to about 900 mg/day.*
FDA Label Image

33edeed5 8a7f 4753 8729 84714238a5c5 09

FDA Label Image

33edeed5 8a7f 4753 8729 84714238a5c5 10

33edeed5 8a7f 4753 8729 84714238a5c5 10
Label for Irbesartan and Hydrochlorothiazide Tablets USP, 150 mg/12.5 mg strength. The film-coated tablets are supplied in a package of 30 by Unichem Pharmaceuticals (USA), Inc., manufactured by Unichem Laboratories Ltd., India. The label includes dosing instructions reference and storage conditions at 20° to 25°C (68° to 77°F).*
FDA Label Image

33edeed5 8a7f 4753 8729 84714238a5c5 11

33edeed5 8a7f 4753 8729 84714238a5c5 11
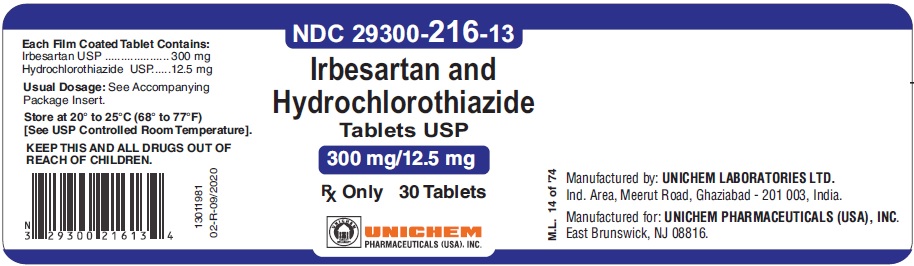
Label for Irbesartan and Hydrochlorothiazide Tablets USP 300 mg/12.5 mg, film-coated tablets. The label shows the NDC 29300-216-13, contains 30 tablets, and is for prescription use only. It is manufactured by Unichem Laboratories Ltd., India, and distributed by Unichem Pharmaceuticals (USA), Inc. The label includes dosage strength, storage instructions, and a barcode.*

* About these descriptions: Image descriptions on this page are generated by automated AI analysis of the product label images from the manufacturer's FDA label submission (SPL). They are provided for reference only and may contain errors or omissions. Always rely on the printed label itself and the official FDA labeling, and consult a pharmacist or healthcare professional with any questions about this product.