Db8f9f09 0af5 4528 A7af 831c2d861375 01
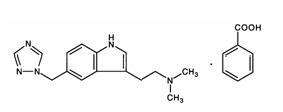
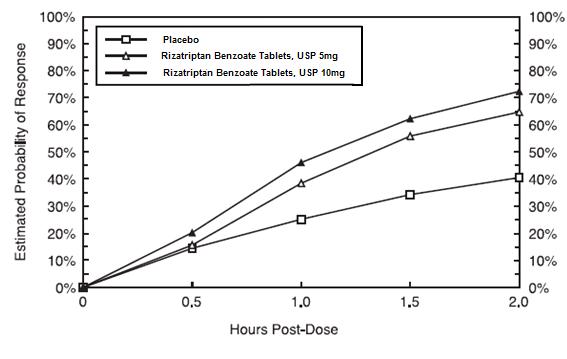
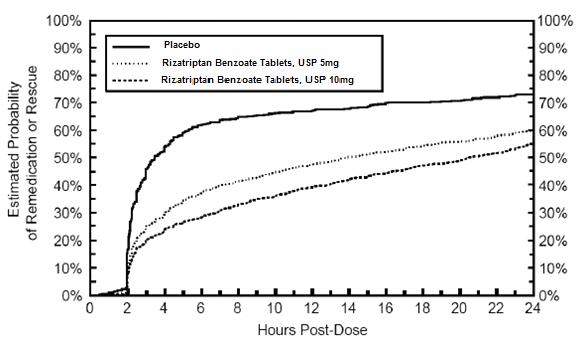
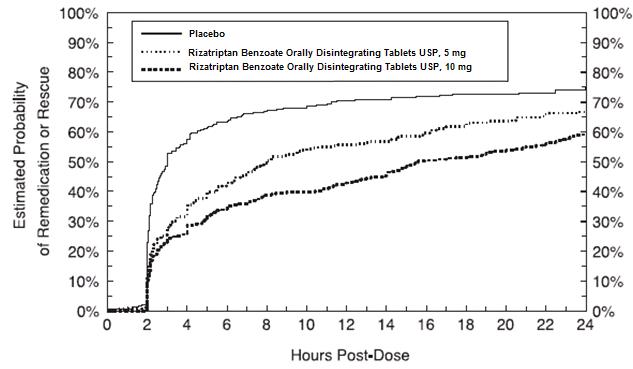
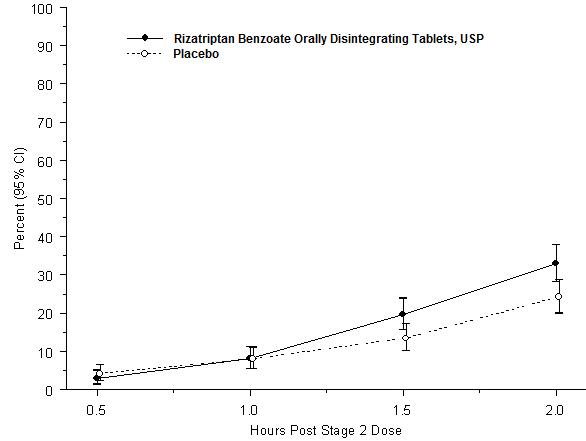
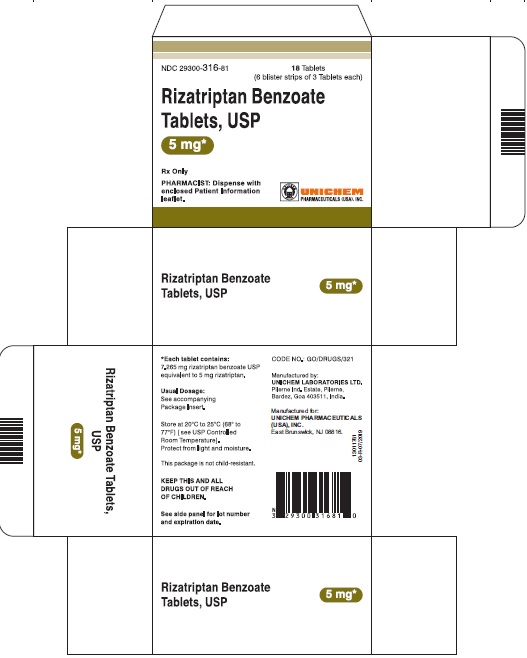
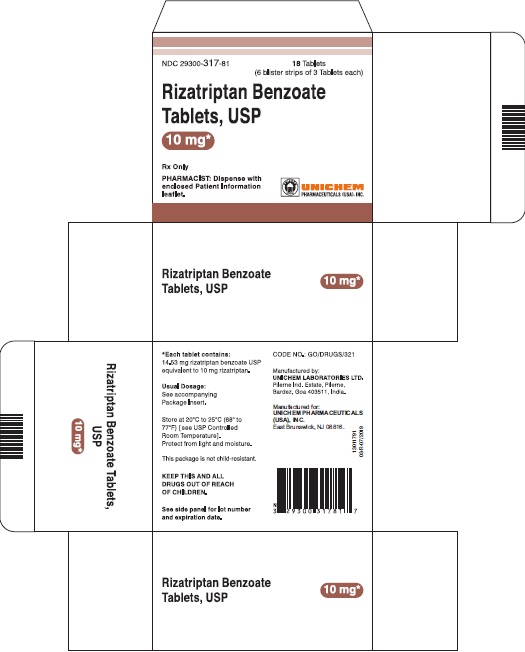
This gallery contains 10 technical images submitted to the FDA as part of the official labeling for Rizatriptan Benzoate (NDC 29300-316). Unlike standard consumer photos, these assets often include clinical data figures, molecular chemical structures, and official manufacturer packaging layouts.
As provided by Unichem Pharmaceuticals (usa), Inc., these visuals offer a comprehensive scientific overview of the product's physical and chemical identity, aiding pharmacists and researchers in product verification and study.


* These product label images have been analyzed using experimental machine learning. Please verify findings with the primary label text.