Sapropterin Dihydrochloride Tablet
Product Images NDC 31722-045

View Photos of Packaging, Regulatory Labels, and Product Appearance

Product Visual Gallery

This gallery contains 5 technical images submitted to the FDA as part of the official labeling for Sapropterin Dihydrochloride (NDC 31722-045). Unlike standard consumer photos, these assets often include clinical data figures, molecular chemical structures, and official manufacturer packaging layouts.

As provided by Camber Pharmaceuticals, Inc., these visuals offer a comprehensive scientific overview of the product's physical and chemical identity, aiding pharmacists and researchers in product verification and study.
FDA Label Image
FDA Label Image

Sapropterindihydrochloridetabletscontainer (Sapropterindihydrochloridetabletscontainer)

Sapropterindihydrochloridetabletscontainer (Sapropterindihydrochloridetabletscontainer)
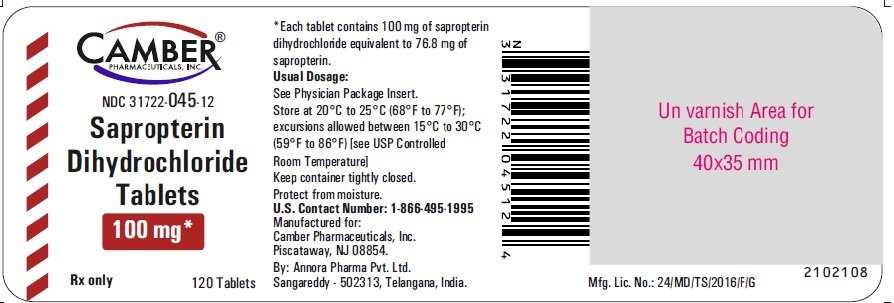
Label for Sapropterin Dihydrochloride Tablets 100 mg by Camber Pharmaceuticals, Inc. The label displays the product name, strength, dosage form, and quantity of 120 tablets. It includes storage instructions, contact information, a barcode, and manufacturing details. The label is designed for oral human prescription use.*
FDA Label Image

Sapropterindihydrochloridetabletsfigure1 (Sapropterindihydrochloridetabletsfigure1)

Sapropterindihydrochloridetabletsfigure1 (Sapropterindihydrochloridetabletsfigure1)
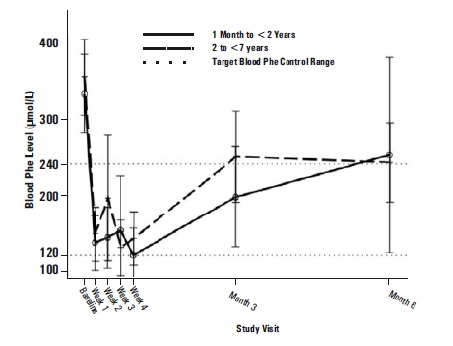
A line graph depicting blood phenylalanine (Phe) levels (μmol/L) over study visits from baseline to month 6. Two groups are shown: children aged 1 month to less than 2 years (solid line) and children aged 2 to less than 7 years (dashed line). The graph includes error bars and indicates a target blood Phe control range between approximately 120 and 240 μmol/L.*
FDA Label Image

Sapropterindihydrochloridetabletsfigure2 (Sapropterindihydrochloridetabletsfigure2)

Sapropterindihydrochloridetabletsfigure2 (Sapropterindihydrochloridetabletsfigure2)
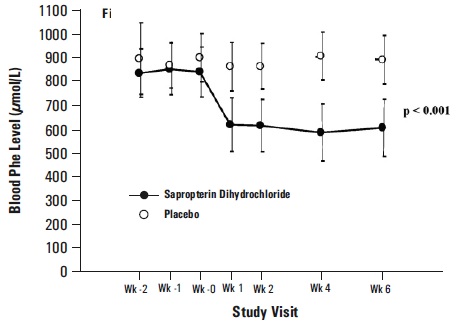
A line graph depicting blood phenylalanine (Phe) levels (µmol/L) over time at various study visits from week -2 to week 6. Two groups are compared: Sapropterin Dihydrochloride (solid circles) and Placebo (open circles). The graph shows lower blood Phe levels over time in the Sapropterin group compared to Placebo, with a statistically significant difference (p < 0.001) at multiple points.*
FDA Label Image

Sapropterindihydrochloridetabletsstructure (Sapropterindihydrochloridetabletsstructure)

Sapropterindihydrochloridetabletsstructure (Sapropterindihydrochloridetabletsstructure)
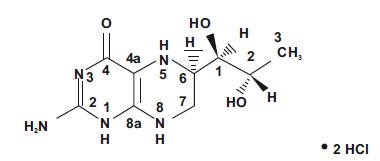
Chemical structure of sapropterin dihydrochloride showing its molecular components and arrangement, including the associated 2 hydrochloride (HCl) groups.*

* About these descriptions: Image descriptions on this page are generated by automated AI analysis of the product label images from the manufacturer's FDA label submission (SPL). They are provided for reference only and may contain errors or omissions. Always rely on the printed label itself and the official FDA labeling, and consult a pharmacist or healthcare professional with any questions about this product.