Product Images Dutasteride

View Photos of Packaging, Labels & Appearance

Product Label Images

The following 12 images provide visual information about the product associated with Dutasteride NDC 31722-131 by Camber Pharmaceuticals, Inc., such as packaging, labeling, and the appearance of the drug itself. This resource could be helpful for medical professionals, pharmacists, and patients seeking to verify medication information and ensure they have the correct product.

0.5 mg 30s

0.5 mg 30s

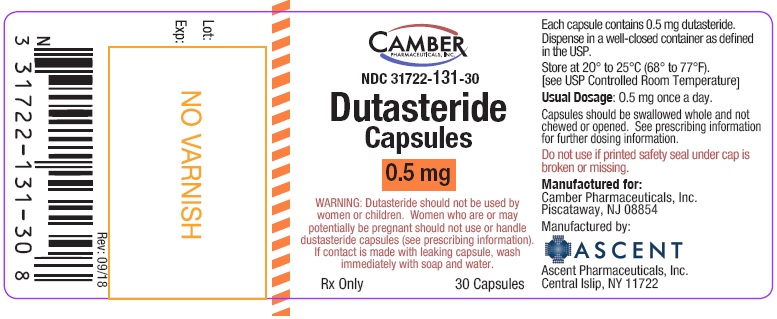
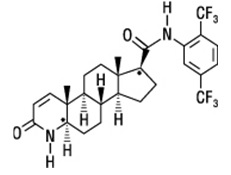
This is a product information sheet for Dutasteride capsules. It is indicated for the treatment of symptoms of benign prostatic hyperplasia (BPH). The capsules contain 0.5mg of dutasteride and should be taken once a day. The capsules should not be opened, chewed or handled by pregnant women. The manufacturer recommends storing the capsules at 20°C -25°C. Contact should be avoided with leaking capsules and washed with soap and water if necessary. The product is manufactured by Camber Pharmaceuticals, distributed by Ascent Pharmaceuticals.*

0.5 mg 90s

0.5 mg 90s

This is the product information for Dutasteride Capsules, a medication used for treating enlarged prostate gland in men. The text contains dosing instructions, storage information, and warnings about the risks of handling the capsules for women and children. The medication should only be taken by men and swallowed whole without breaking or chewing the capsules. It is manufactured by Camber Pharmaceuticals and Ascent Pharmaceuticals.*

fig1 - Fig1

fig1 - Fig1

The text is describing a graph titled "Figure 1. AUA-ST Score" that shows the change from baseline in AUASI over time in a randomized, double-blind, placebo-controlled trial. The x-axis shows the months of treatment and the y-axis shows the mean change from baseline in AUA-ST score, which ranges from 0 to 35. There are two lines on the graph, one representing placebo and the other representing Dutasteride. The graph includes data for 212 participants in each group.*

fig2 - Fig2

fig2 - Fig2

This is a graph displaying the percentage of subjects who experienced acute urinary retention during a 24-month period in a randomized, double-blind, placebo-controlled trial. The x-axis shows the months of treatment and the y-axis shows the percentage of patients. The blue line represents the placebo group, and the orange line represents the group treated with dutasteride. The table below provides specific numbers of events and number of patients at risk at each time point.*

fig3 - Fig3

fig3 - Fig3

This is a figure showing the percentage of people who had surgery for benign prostatic hyperplasia (BPH) over a 24-month period in a randomized, double-blind, placebo-controlled trial. The x-axis shows the months of treatment, while the y-axis represents the percentage of people who had surgery. There are two groups represented in the figure: the placebo group and the dutasteride group. The placebo group had 13 events (people who had surgery) after six months of treatment, which increased to 89 events at the end of 24 months. On the other hand, the dutasteride group had only 12 events after six months of treatment, which increased to 47 events at the end of 24 months. The number of people at risk (who were still in the trial) decreased over time in both groups.*

fig4 - Fig4

fig4 - Fig4

The provided text is a graph, displaying the percentage change in prostate volume from baseline over time (in months) for randomized, double-blind, placebo-controlled trials pooled. Two lines are plotted - one for placebo and one for dutasteride treatment. The x-axis displays the number of months of treatment and the y-axis displays the percentage change in prostate volume. It appears that dutasteride treatment resulted in a decrease in prostate volume, while the placebo group remained relatively stable.*

fig5 - Fig5

fig5 - Fig5

fig6 - Fig6

fig6 - Fig6

Figure 6 shows the International Prostate Symptom Score Change from Baseline over a 48-month period in a Randomized, Double-blind, Parallel-Group Trial named CombAT Trial. The graph displays the scores of participants under different treatments for different months. The treatments were Dutasteride + tamsulosin, Dutasteride 0.5 mg and Tamsulosin 0.4 mg.*

fig7 - Fig7

fig7 - Fig7

The text is describing a figure showing the Qmax Change from Baseline over a 24-month period in a randomized, double-blind, parallel-group trial called CombAT trial. The figure displays the mean change from baseline with four measured points over 24 months of treatment. The treatment includes Dutasteride + Tamsulosin, Dutasteride 0.5mg, and Tamsulosin 0.4mg.*

structure - Structure

structure - Structure

tab1 - Tab1

tab1 - Tab1

The given text shows a tabular presentation of adverse reactions resulting from the administration of Dutasteride compared to the Placebo group reported in a 24-month period. The adverse reactions occur more frequently in the Dutasteride group than the placebo group within a particular time of onset. Sexual adverse reactions (such as impotence, decreased libido, and ejaculation disorders) are associated with dutasteride treatment and may continue after treatment discontinuation. Breast disorders (breast tenderness and breast enlargement) are also observed in both groups.*

tab2 - Tab2

tab2 - Tab2

The text describes adverse reactions that occurred during a 43-month period in patients receiving combination therapy of Dutasteride and Tamsulosin compared to those receiving only one of these drugs. The adverse reactions include ejaculation disorder, impotence, decreased libido, breast disorders, and dizziness. The onset of these reactions varied during the treatment period.*

* The product label images have been analyzed using a combination of traditional computing and machine learning techniques. It should be noted that the descriptions provided may not be entirely accurate as they are experimental in nature. Use the information in this page at your own discretion and risk.