Glycerol Phenylbutyrate Liquid
Product Images NDC 31722-605

View Photos of Packaging, Regulatory Labels, and Product Appearance

Product Visual Gallery

This gallery contains 9 technical images submitted to the FDA as part of the official labeling for Glycerol Phenylbutyrate (NDC 31722-605). Unlike standard consumer photos, these assets often include clinical data figures, molecular chemical structures, and official manufacturer packaging layouts.

As provided by Camber Pharmaceuticals, Inc., these visuals offer a comprehensive scientific overview of the product's physical and chemical identity, aiding pharmacists and researchers in product verification and study.

FDA Label Image

Glycerolphenylbutyrate1scartonlabel (Glycerolphenylbutyrate1scartonlabel)
Glycerolphenylbutyrate1scartonlabel (Glycerolphenylbutyrate1scartonlabel)
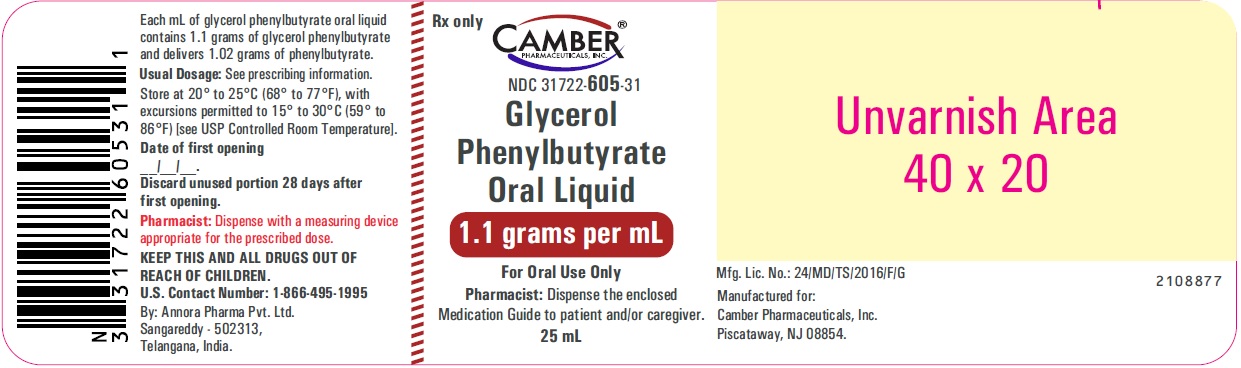
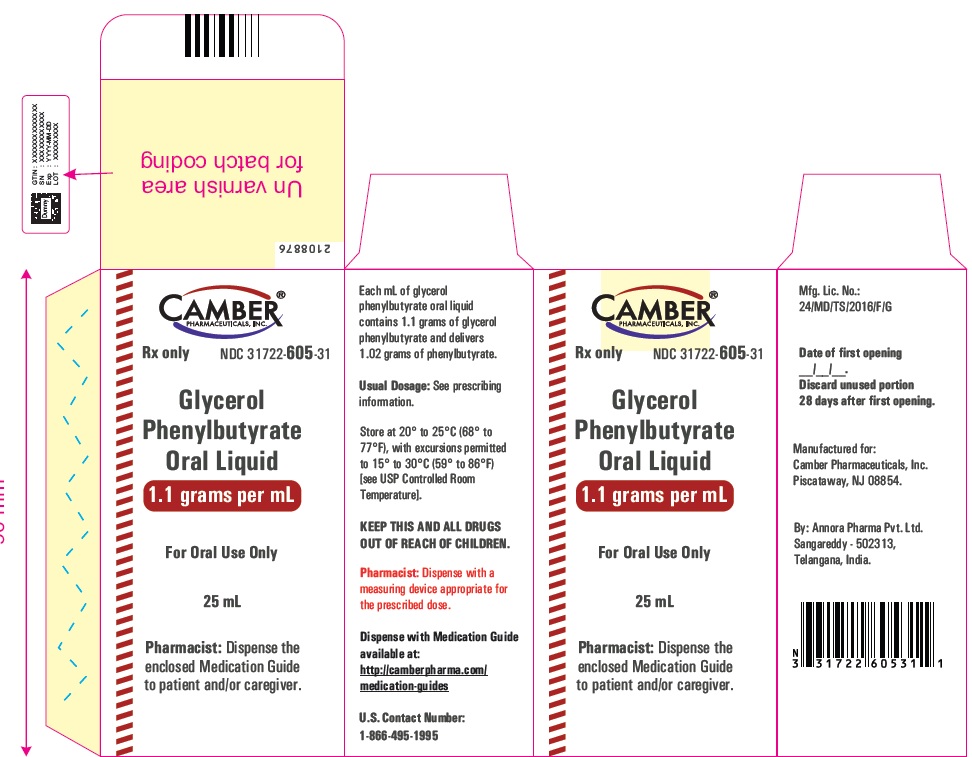
Label for Glycerol Phenylbutyrate Oral Liquid, 1.1 grams per mL, in a 25 mL bottle. The product is labeled Rx only and manufactured by Camber Pharmaceuticals, Inc. Instructions include dispensing a Medication Guide and storage guidance. The label also contains manufacturing details and a barcode.*

FDA Label Image
FDA Label Image

Glycerolphenylbutyratecontainerlabel (Glycerolphenylbutyratecontainerlabel)

Glycerolphenylbutyratecontainerlabel (Glycerolphenylbutyratecontainerlabel)
Label for Glycerol Phenylbutyrate Oral Liquid 1.1 grams per mL, 25 mL bottle, by Camber Pharmaceuticals, Inc. The label includes dosage strength, NDC 31722-605-31, storage instructions, pharmacist dispensing guidance, and manufacturer details. The label also states the product is Rx only and for oral use.*
FDA Label Image

Glycerolphenylbutyratefigure1 (Glycerolphenylbutyratefigure1)

Glycerolphenylbutyratefigure1 (Glycerolphenylbutyratefigure1)
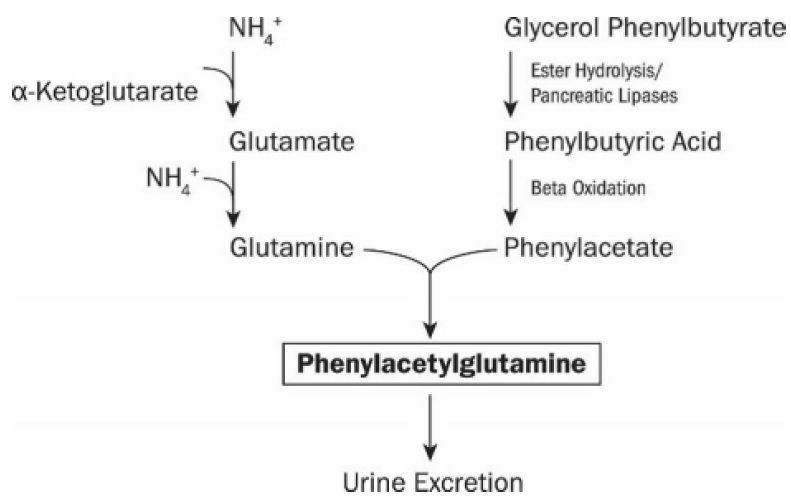
An illustration depicting the metabolic pathway of Glycerol Phenylbutyrate. It shows Glycerol Phenylbutyrate being hydrolyzed by ester hydrolysis and pancreatic lipases to Phenylbutyric Acid, which undergoes beta oxidation to Phenylacetate. Concurrently, α-Ketoglutarate with NH4+ produces Glutamate and then Glutamine. Phenylacetate and Glutamine combine to form Phenylacetylglutamine, which is excreted in urine.*
FDA Label Image

Glycerolphenylbutyratefigure2 (Glycerolphenylbutyratefigure2)

Glycerolphenylbutyratefigure2 (Glycerolphenylbutyratefigure2)
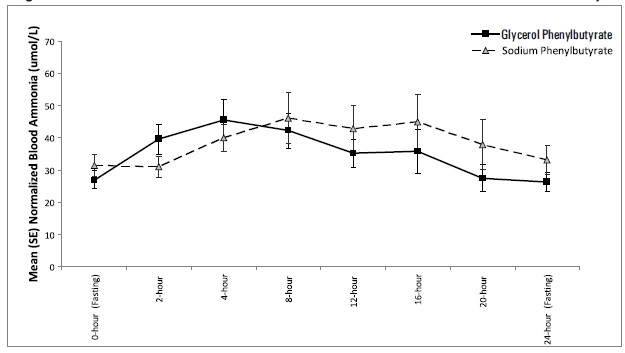
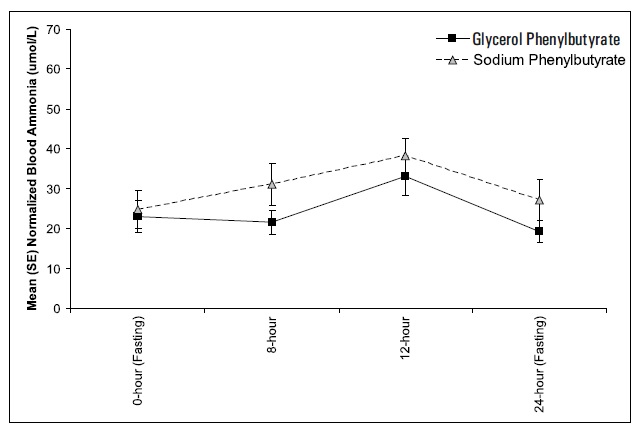
A line graph comparing mean normalized blood ammonia levels (μmol/L) over a 24-hour period for Glycerol Phenylbutyrate and Sodium Phenylbutyrate. The x-axis shows time points from 0 hour (fasting) to 24 hours (fasting), and the y-axis shows mean blood ammonia levels with error bars representing standard error. Glycerol Phenylbutyrate data is marked with squares and a solid line, while Sodium Phenylbutyrate is marked with triangles and a dashed line.*
FDA Label Image

Glycerolphenylbutyratefigure3 (Glycerolphenylbutyratefigure3)

Glycerolphenylbutyratefigure3 (Glycerolphenylbutyratefigure3)
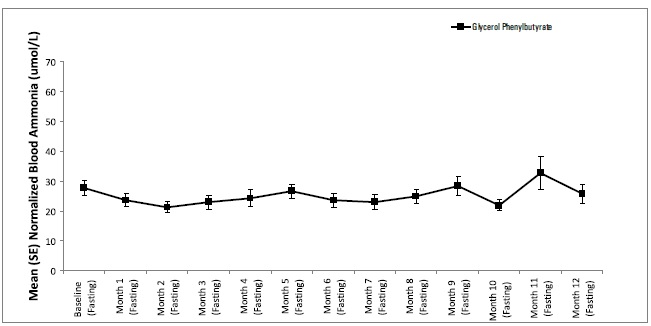
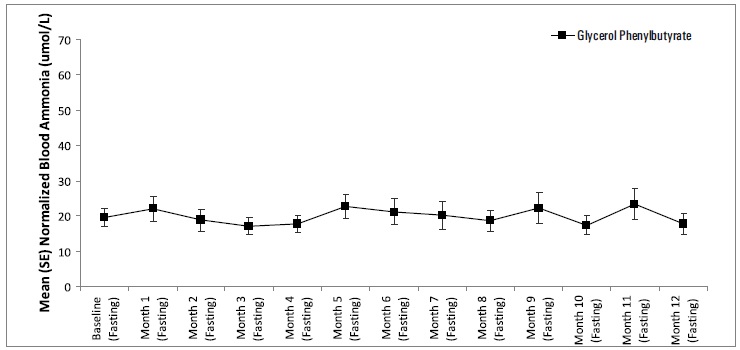
A line graph showing mean normalized blood ammonia levels (μmol/L) with standard error bars across multiple time points, including baseline and fasting states, for Glycerol Phenylbutyrate. The x-axis represents time points from baseline through Month 12, alternating between fasting and non-fasting measurements.*
FDA Label Image

Glycerolphenylbutyratefigure4 (Glycerolphenylbutyratefigure4)

Glycerolphenylbutyratefigure4 (Glycerolphenylbutyratefigure4)
A line graph comparing mean normalized blood ammonia levels (µmol/L) over time between Glycerol Phenylbutyrate and Sodium Phenylbutyrate. The x-axis shows time points at 0-hour (fasting), 8-hour, 12-hour, and 24-hour (fasting). The y-axis represents mean blood ammonia levels. Glycerol Phenylbutyrate is marked with squares and sodium phenylbutyrate with triangles, showing trends with error bars for standard error at each time point.*
FDA Label Image

Glycerolphenylbutyratefigure5 (Glycerolphenylbutyratefigure5)

Glycerolphenylbutyratefigure5 (Glycerolphenylbutyratefigure5)
Line graph depicting the mean (SE) normalized blood ammonia levels (µmol/L) over 12 months during fasting and non-fasting periods for Glycerol Phenylbutyrate. The y-axis shows ammonia concentration ranging from 0 to 70 µmol/L, and the x-axis indicates time points from baseline through month 12, alternating between fasting and non-fasting measurements.*
FDA Label Image

Glycerolphenylbutyratestructure (Glycerolphenylbutyratestructure)

Glycerolphenylbutyratestructure (Glycerolphenylbutyratestructure)
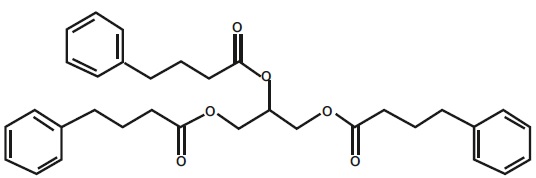
Chemical structure of the active ingredient Glycerol Phenylbutyrate. The diagram shows the molecular framework including phenyl groups and ester linkages characteristic of this compound.*

* About these descriptions: Image descriptions on this page are generated by automated AI analysis of the product label images from the manufacturer's FDA label submission (SPL). They are provided for reference only and may contain errors or omissions. Always rely on the printed label itself and the official FDA labeling, and consult a pharmacist or healthcare professional with any questions about this product.