Tadalafil Tablet
Product Images NDC 31722-647

View Photos of Packaging, Regulatory Labels, and Product Appearance

Product Visual Gallery

This gallery contains 8 technical images submitted to the FDA as part of the official labeling for Tadalafil (NDC 31722-647). Unlike standard consumer photos, these assets often include clinical data figures, molecular chemical structures, and official manufacturer packaging layouts.

As provided by Camber Pharmaceuticals, Inc., these visuals offer a comprehensive scientific overview of the product's physical and chemical identity, aiding pharmacists and researchers in product verification and study.

FDA Label Image

Tadalafil20mg30scount (Tadalafil20mg30scount)
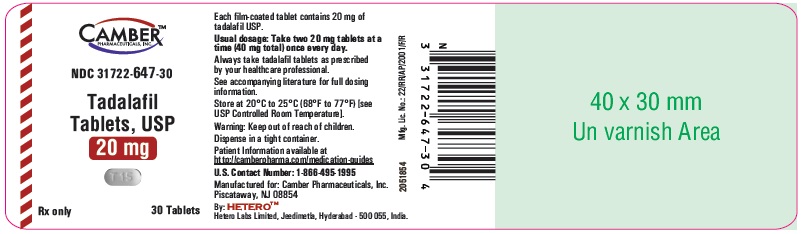
Tadalafil20mg30scount (Tadalafil20mg30scount)
The packaging label for Tadalafil Tablets, USP, 20 mg, oral tablets from Camber Pharmaceuticals, Inc. The label includes the product name, strength, dosage form, NDC 31722-647-30, and specifies a package size of 30 tablets. It features dosage instructions, storage conditions, a warning to keep out of reach of children, and manufacturer information including Hetero Labs Limited in India.*
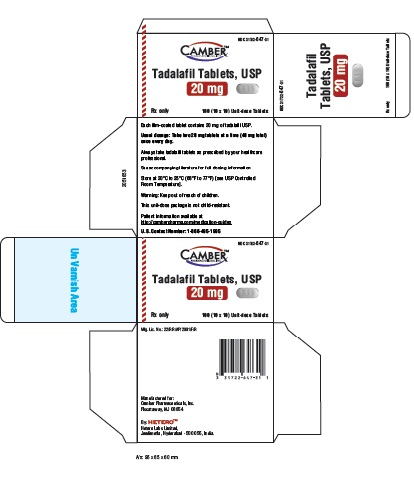
FDA Label Image

Tadalafil20mgcarton (Tadalafil20mgcarton)

Tadalafil20mgcarton (Tadalafil20mgcarton)
Packaging label for Tadalafil Tablets, USP 20 mg oral tablets by Camber Pharmaceuticals, Inc. The label displays the drug name, strength (20 mg), and quantity (90 tablets). Includes storage instructions, warnings, and a barcode. The design features a white background with red and black text, and the Camber logo is present.*
FDA Label Image

Tadalafilcamberlogo1 (Tadalafilcamberlogo1)

FDA Label Image

Tadalafilcamberlogo1 (Tadalafilcamberlogo2)

FDA Label Image

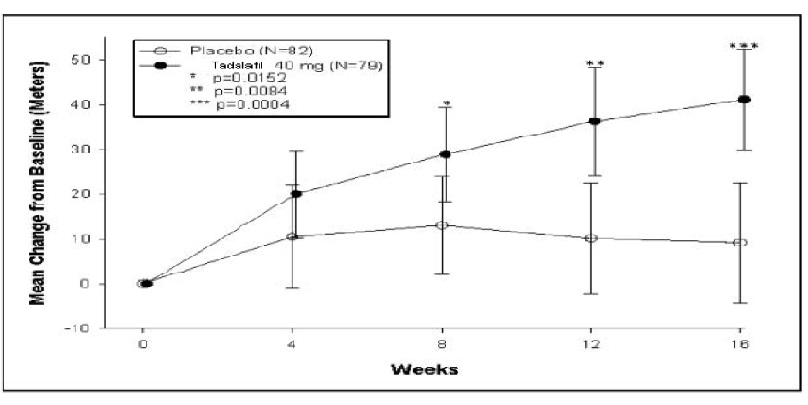
Tadalafilfigure1 (Tadalafilfigure1)

Tadalafilfigure1 (Tadalafilfigure1)
Line graph comparing mean change from baseline in meters over 16 weeks for Tadalafil 40 mg (N=76) versus placebo (N=82). The y-axis shows mean change from baseline in meters and the x-axis shows weeks. Tadalafil group shows a higher increase from baseline than placebo at weeks 4, 8, 12, and 16 with statistical significance indicated by p-values (0.0152, 0.0084, and 0.0004). Error bars display variability at each time point.*
FDA Label Image

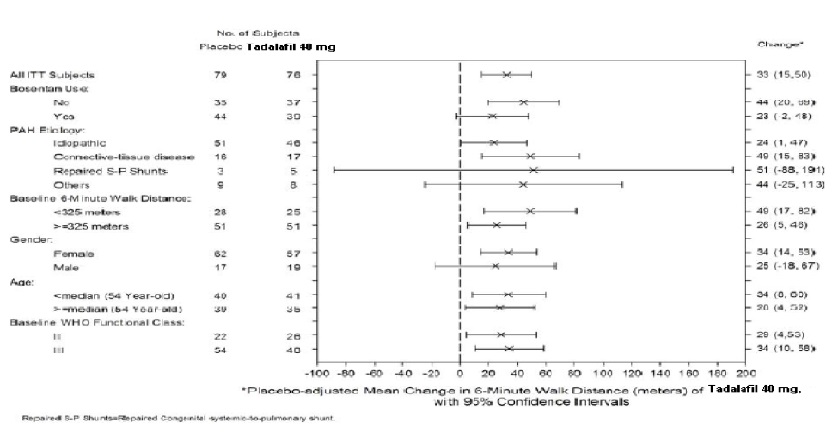
Tadalafilfigure2 (Tadalafilfigure2)

Tadalafilfigure2 (Tadalafilfigure2)
A forest plot illustrating placebo-adjusted mean changes in 6-minute walk distance (meters) for Tadalafil 40 mg with 95% confidence intervals across multiple subgroups. The x-axis represents change in distance, ranging from -100 to 200 meters, while the y-axis lists subject characteristics like bosentan use, PAH etiology, baseline walking distance, gender, age, and WHO functional class. Each subgroup shows point estimates and confidence intervals for the drug effect.*
FDA Label Image

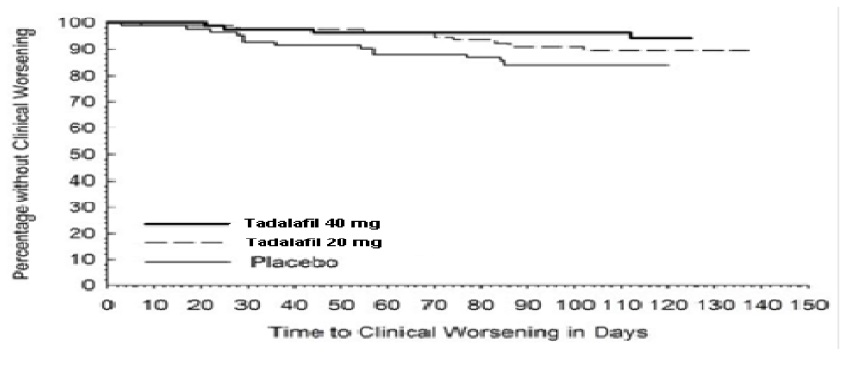
Tadalafilfigure3 (Tadalafilfigure3)

Tadalafilfigure3 (Tadalafilfigure3)
A Kaplan-Meier curve graph comparing percentage without clinical worsening over time (in days) for Tadalafil 40 mg, Tadalafil 20 mg, and placebo groups. The y-axis shows percentage without clinical worsening from 0 to 100%, and the x-axis shows time to clinical worsening in days from 0 to 150. The graph illustrates differences in clinical worsening rates among the three groups over the study period.*
FDA Label Image

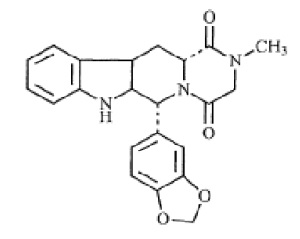
Tasalafilstructure (Tadalafilstructure)

Tasalafilstructure (Tadalafilstructure)
Chemical structure of Tadalafil, showing its molecular skeleton including fused rings and functional groups characteristic of the compound.*

* About these descriptions: Image descriptions on this page are generated by automated AI analysis of the product label images from the manufacturer's FDA label submission (SPL). They are provided for reference only and may contain errors or omissions. Always rely on the printed label itself and the official FDA labeling, and consult a pharmacist or healthcare professional with any questions about this product.