Alendronate Sodium
Product Images NDC 33261-993

View Photos of Packaging, Regulatory Labels, and Product Appearance

Product Visual Gallery

This gallery contains 10 technical images submitted to the FDA as part of the official labeling for Alendronate Sodium (NDC 33261-993). Unlike standard consumer photos, these assets often include clinical data figures, molecular chemical structures, and official manufacturer packaging layouts.

As provided by Aidarex Pharmaceuticals Llc, these visuals offer a comprehensive scientific overview of the product's physical and chemical identity, aiding pharmacists and researchers in product verification and study.

FDA Label Image

Chemical Structure (Alendronate 35 mg For Teva 1)
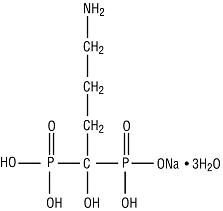
Chemical Structure (Alendronate 35 mg For Teva 1)
Chemical structure of Alendronate Sodium, showing its phosphonate groups, amino side chain, and hydration state (3H2O). The diagram depicts the molecular arrangement of atoms and bonds characteristic of this active ingredient.*
FDA Label Image

Image Label (Alendronate 35 mg For Teva 10)

Image Label (Alendronate 35 mg For Teva 10)
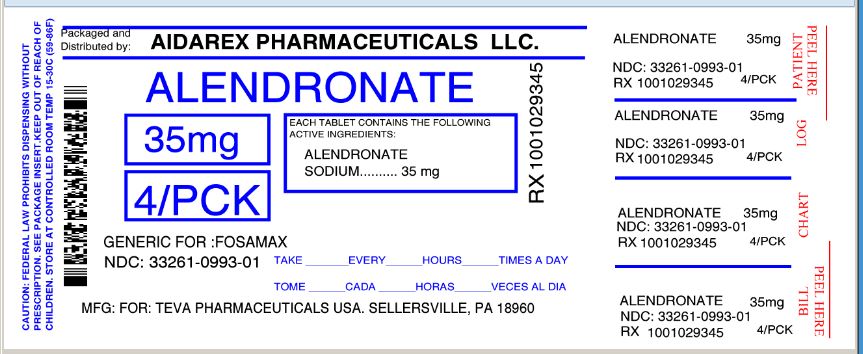
Alendronate 35 mg tablet packaging label from Aidarex Pharmaceuticals LLC. The label states the active ingredient as Alendronate Sodium 35 mg, packaging quantity as 4 per pack, and indicates the manufacturer as Teva Pharmaceuticals USA located in Sellersville, PA. It also lists the product NDC as 33261-0993-01 and notes it as a generic for Fosamax.*
FDA Label Image

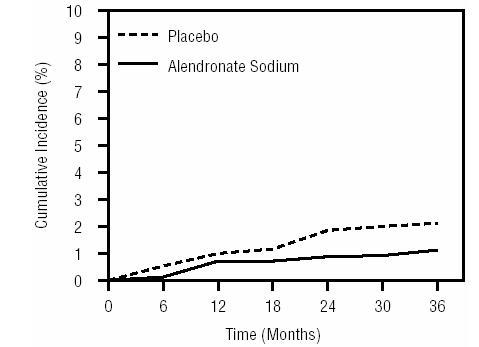
Figure 1 (Alendronate 35 mg For Teva 2)

Figure 1 (Alendronate 35 mg For Teva 2)
A line graph showing the cumulative incidence percentage over time (in months) for two groups: one treated with Alendronate Sodium and one with a placebo. The graph compares incidence rates across a 36-month period, with the placebo group represented by a dashed line and the Alendronate Sodium group by a solid line.*
FDA Label Image

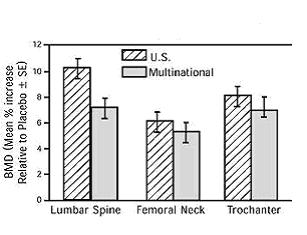
Figure 2 (Alendronate 35 mg For Teva 3)

Figure 2 (Alendronate 35 mg For Teva 3)
A bar chart comparing the mean percentage increase in bone mineral density (BMD) relative to placebo plus standard error (SE) at three anatomical sites: lumbar spine, femoral neck, and trochanter. Results are shown for two groups labeled 'U.S.' and 'Multinational.' The lumbar spine shows the highest increase, followed by the trochanter and femoral neck.*
FDA Label Image

Figure 3 (top) (Alendronate 35 mg For Teva 4)

Figure 3 (top) (Alendronate 35 mg For Teva 4)
A line graph from a U.S. study comparing the mean percentage change from baseline in Bone Mineral Density (BMD) over 36 months between Alendronate 10 mg and placebo. The x-axis represents time in months, and the y-axis shows BMD change. Alendronate 10 mg shows a steady increase in BMD, while placebo remains near baseline.*
FDA Label Image

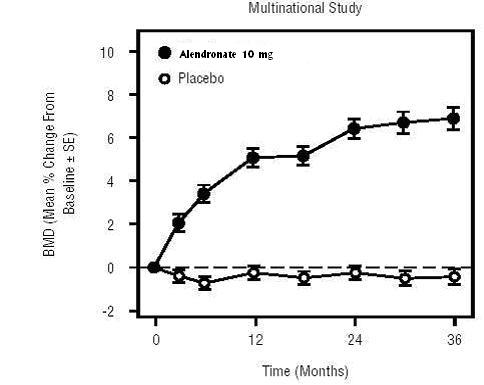
Figure 3 (bottom) (Alendronate 35 mg For Teva 5)

Figure 3 (bottom) (Alendronate 35 mg For Teva 5)
A line graph titled 'Multinational Study' comparing mean percentage change in Bone Mineral Density (BMD) from baseline over 36 months. The graph shows data for Alendronate 10 mg and placebo groups, with Alendronate group displaying an increasing BMD trend up to about 7%, while the placebo group remains near zero change.*
FDA Label Image

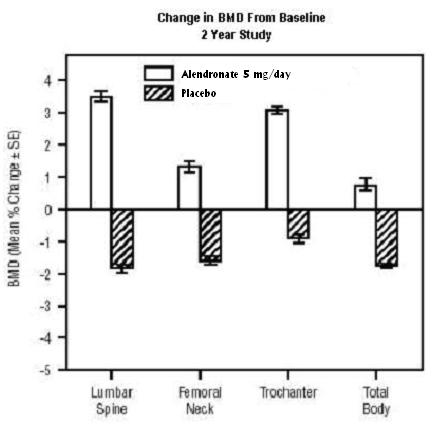
Figure 4 (top) (Alendronate 35 mg For Teva 6)

Figure 4 (top) (Alendronate 35 mg For Teva 6)
A bar graph showing change in bone mineral density (BMD) from baseline over a 2-year study for Alendronate 5 mg/day and placebo groups. The graph compares BMD changes at the lumbar spine, femoral neck, trochanter, and total body, with positive increases shown for Alendronate and decreases or lower changes for placebo.*
FDA Label Image

Figure 4 (bottom) (Alendronate 35 mg For Teva 7)

Figure 4 (bottom) (Alendronate 35 mg For Teva 7)
A bar chart titled 'Change in BMD From Baseline 3 Year Study' comparing Alendronate 5 mg/day and placebo groups. The chart shows mean percentage change with standard error in bone mineral density (BMD) for Lumbar Spine, Femoral Neck, Trochanter, and Total Body sites. Alendronate groups show positive changes, while placebo groups show negative or minimal changes across all sites.*
FDA Label Image

Figure 5 (Alendronate 35 mg For Teva 8)

Figure 5 (Alendronate 35 mg For Teva 8)
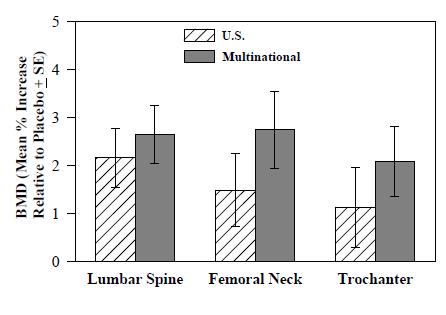
A bar graph comparing mean percentage increase in bone mineral density (BMD) relative to placebo plus standard error (SE) at the lumbar spine, femoral neck, and trochanter between U.S. and multinational groups. Bars show higher BMD increase in the multinational group at femoral neck and trochanter sites. Lumbar spine values are closer between the two groups.*
FDA Label Image

Figure 6 (Alendronate 35 mg For Teva 9)

Figure 6 (Alendronate 35 mg For Teva 9)
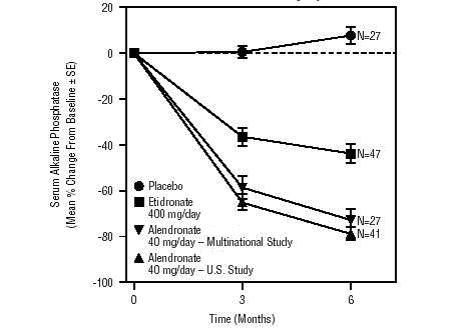
A line graph depicting serum alkaline phosphatase mean percentage change from baseline with standard error over 6 months. It compares placebo, etidronate 400 mg/day, and alendronate 40 mg/day from both multinational and U.S. studies, showing distinct trends for each treatment group over time.*

* About these descriptions: Image descriptions on this page are generated by automated AI analysis of the product label images from the manufacturer's FDA label submission (SPL). They are provided for reference only and may contain errors or omissions. Always rely on the printed label itself and the official FDA labeling, and consult a pharmacist or healthcare professional with any questions about this product.