Memantine Hydrochloride Solution
Product Images NDC 33342-066

12 FDA label images from Macleods Pharmaceuticals Limited · Packaging, Regulatory Labels, and Product Appearance

Product Visual Gallery

This gallery contains 12 technical images submitted to the FDA as part of the official labeling for Memantine Hydrochloride (NDC 33342-066). Unlike standard consumer photos, these assets often include clinical data figures, molecular chemical structures, and official manufacturer packaging layouts.

As provided by Macleods Pharmaceuticals Limited, these visuals offer a comprehensive scientific overview of the product's physical and chemical identity, aiding pharmacists and researchers in product verification and study.

FDA Label Image

Structure (Structure)

Structure (Structure)
Chemical structure diagram showing the molecular structure of Memantine Hydrochloride, including an amine group with hydrochloride and methyl substituents on a polycyclic cage framework.*
FDA Label Image

Figure-1 (Memantine Figure 1)

Figure-1 (Memantine Figure 1)
A line graph depicting mean change from baseline in ADCS-ADL score over 28 weeks of treatment comparing placebo and memantine hydrochloride. The x-axis represents weeks of treatment (0, 4, 12, 28), and the y-axis shows mean change from baseline with error bars. The graph highlights clinical improvement above zero and clinical decline below zero, with memantine hydrochloride showing less decline than placebo over time.*
FDA Label Image

Figure-2 (Memantine Figure 2)

Figure-2 (Memantine Figure 2)
A cumulative percentage of patients chart comparing Placebo and Memantine Hydrochloride, showing ADCS-ADL change from baseline on the X-axis and cumulative percentage on the Y-axis. The graph displays data trends for both groups with distinct markers.*
FDA Label Image

Figure-3 (Memantine Figure 3)

Figure-3 (Memantine Figure 3)
A line graph showing the mean change from baseline in SIB score over 28 weeks of treatment, comparing Placebo and Memantine Hydrochloride 2 mg/mL oral solution. The y-axis represents mean change (± SEM) in the SIB score, with clinical improvement indicated above zero and clinical decline below. The graph shows Placebo group scores declining steadily, while Memantine group scores remain near baseline with less decline.*
FDA Label Image

Figure-4 (Memantine Figure 4)

Figure-4 (Memantine Figure 4)
A cumulative percentage plot showing the response of patients to Memantine Hydrochloride 2 mg/mL oral solution compared to a placebo. The x-axis represents SIB change from baseline, with negative values, while the y-axis shows the cumulative percentage of patients up to 100%. Two curves represent placebo and Memantine Hydrochloride treatment groups.*
FDA Label Image

Figure-5 (Memantine Figure 5)

Figure-5 (Memantine Figure 5)
A line graph comparing the mean change from baseline in ADCS-ADL score over 24 weeks of treatment between placebo/donepezil and memantine hydrochloride/donepezil groups. The x-axis represents weeks of treatment; the y-axis represents mean change with SEM. The memantine group shows a less steep decline, indicating slower clinical decline compared to placebo.*
FDA Label Image

Figure-6 (Memantine Figure 6)

Figure-6 (Memantine Figure 6)
A cumulative percentage of patients chart comparing the effect of Memantine Hydrochloride/Donepezil versus Placebo/Donepezil on ADCS-ADL change from baseline. The x-axis represents ADCS-ADL change from baseline, and the y-axis shows the cumulative percentage of patients, illustrating patient response distribution for both treatment groups.*
FDA Label Image

Figure-7 (Memantine Figure 7)

Figure-7 (Memantine Figure 7)
A line graph showing the mean change from baseline in SIB score over 24 weeks of treatment, comparing Memantine Hydrochloride/Donepezil with Placebo/Donepezil. The vertical axis represents the mean change (± SEM), and the horizontal axis represents the weeks of treatment. Memantine Hydrochloride/Donepezil shows an upward trend indicating clinical improvement, while Placebo/Donepezil shows a decline after 16 weeks, indicating clinical decline.*
FDA Label Image

Figure-8 (Memantine Figure 8)

Figure-8 (Memantine Figure 8)
A cumulative percentage of patients graph comparing SIB change from baseline for two treatments: Placebo/Donepezil and Memantine Hydrochloride/Donepezil. The x-axis represents the SIB change from baseline, and the y-axis shows the cumulative percentage of patients, illustrating patient response distribution for each treatment group.*
FDA Label Image

Figure-9 (Memantine Figure 9)

Figure-9 (Memantine Figure 9)
Memantine Hydrochloride Oral Solution 2 mg/mL in a 240 mL bottle by Macleods Pharmaceuticals Limited. The image shows the product carton with essential labeling information, including strength and NDC number, next to a bottle outline and a detailed image of a dosing syringe and measuring cup used for oral administration.*
FDA Label Image

Fig-10 (Memantine Fig 10)

Fig-10 (Memantine Fig 10)
An illustrated step-by-step instructional guide for using Memantine Hydrochloride Oral Solution with a dosing syringe and blue syringe adaptor cap. It includes removing the syringe and plastic tube, opening the child-resistant bottle cap, attaching and securing the syringe adaptor, withdrawing the correct dose, administering the solution orally, resealing the bottle, rinsing the syringe, and storing the bottle upright.*
FDA Label Image

222 (Metformin Oral Solution 2mg)

222 (Metformin Oral Solution 2mg)
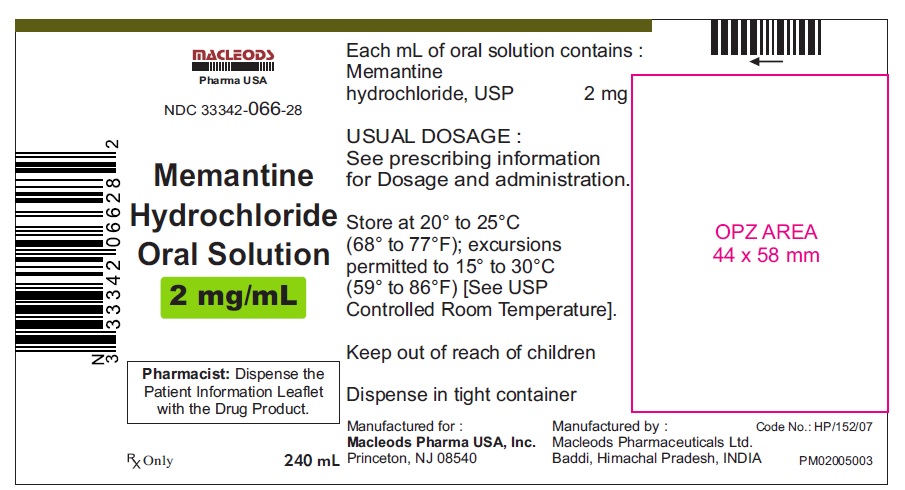
The image shows a drug label panel for Memantine Hydrochloride Oral Solution, 2 mg/mL. It states that each milliliter contains 2 mg of memantine hydrochloride USP. It includes storage instructions (20° to 25°C with excursions permitted to 15° to 30°C) and safety notes such as keeping out of reach of children and dispensing in a tight container. The label also directs pharmacists to provide the Patient Information Leaflet with the product. The solution volume is 240 mL, manufactured by Macleods Pharmaceuticals Ltd. in India and for Macleods Pharma USA, Inc.*

* About these descriptions: Image descriptions on this page are generated by automated AI analysis of the product label images from the manufacturer's FDA label submission (SPL). They are provided for reference only and may contain errors or omissions. Always rely on the printed label itself and the official FDA labeling, and consult a pharmacist or healthcare professional with any questions about this product.